This article explains how AI-based multiscale design analytics—specifically scale and cluster detection—are integrated into a design dashboard that links metrics directly to student work, giving instructors clearer, context-rich insights within their existing workflow.This article explains how AI-based multiscale design analytics—specifically scale and cluster detection—are integrated into a design dashboard that links metrics directly to student work, giving instructors clearer, context-rich insights within their existing workflow.

AI Model Integration Streamlines Feedback in Multiscale Design Environments

2025/12/09 03:00
4 min read
For feedback or concerns regarding this content, please contact us at crypto.news@mexc.com

Abstract and 1. Introduction

  1. Prior Work and 2.1 Educational Objectives of Learning Activities

    2.2 Multiscale Design

    2.3 Assessing Creative Visual Design

    2.4 Learning Analytics and Dashboards

  2. Research Artifact/Probe

    3.1 Multiscale Design Environment

    3.2 Integrating a Design Analytics Dashboard with the Multiscale Design Environment

  3. Methodology and Context

    4.1 Course Contexts

    4.2 Instructor interviews

  4. Findings

    5.1 Gaining Insights and Informing Pedagogical Action

    5.2 Support for Exploration, Understanding, and Validation of Analytics

    5.3 Using Analytics for Assessment and Feedback

    5.4 Analytics as a Potential Source of Self-Reflection for Students

  5. Discussion + Implications: Contextualizing: Analytics to Support Design Education

    6.1 Indexicality: Demonstrating Design Analytics by Linking to Instances

    6.2 Supporting Assessment and Feedback in Design Courses through Multiscale Design Analytics

    6.3 Limitations of Multiscale Design Analytics

  6. Conclusion and References

A. Interview Questions

\

3.2 Integrating a Design Analytics Dashboard with the Multiscale Design Environment

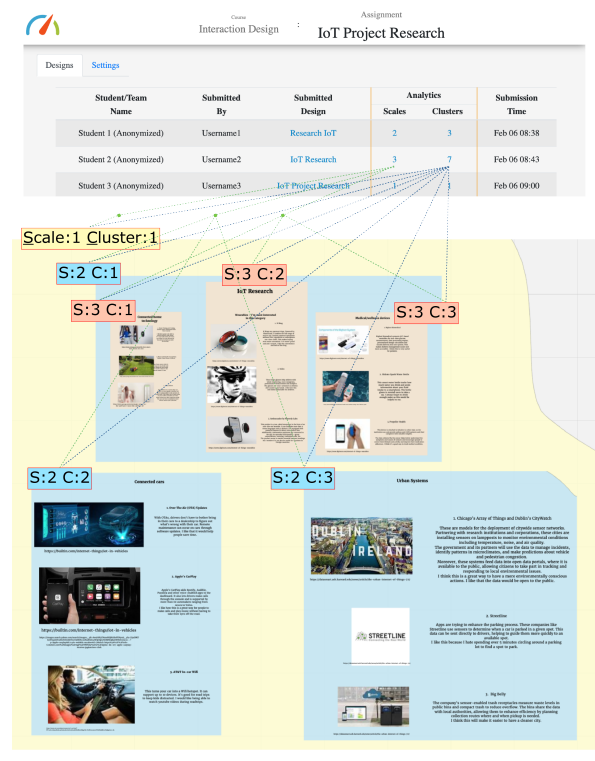
In order to connect design assessment with design work, we integrated multiscale design analytics into the multiscale design environment. To contextualize the analytics, we link them with design work instances. The multiscale design analytics that we present to instructors are (1) the number of scales and (2) the number of clusters present within a given design work instance. Our linkage of design analytics to design instances makes visible to users what is being measured by analytics.

\ We choose an off-the-shelf AI model suitable for computing multiscale design analytics. As we described in the introduction, our goal is to explore the potential of AI-based multiscale design analytics for supporting design instructors, not to compare or refute particular techniques. We invoke Jain et al.’s [40] spatial clustering based model, as it has been previously used in design education contexts, for recognizing clusters of elements nested across scales within multiscale design work. We input position, width, height, and transforms of multiscale design elements—extracting them from the JSON representation—and obtain scales and clusters as output from the model.

\ We integrate a design analytics dashboard directly with the multiscale design environment in which students perform their work. As instructors regularly use the environment to view and assess student projects, the dashboard integration streamlines the process of making AI-based analytics available in their situated work contexts. The dashboard interface allows instructors to manage a course, its assignments, and submission to the assignments. When an instructor views

\ Fig. 3. We integrated a dashboard with the underlying design environment with the goal of conveying the meaning of analytics to users. Clicking an analytic presented on the dashboard interface opens the actual design environment and shows the corresponding AI identified nested scales, with all clusters at a particular scale rendered in the same background color. In the above figure, the outermost scale comprises one cluster—including all design elements—which is rendered in yellow color. The next inner scale has three clusters (one at top and two at bottom), which are rendered in blue. The innermost scale has three clusters—within the top blue cluster—which are rendered in brown. The visualization makes relationships visible, between particular design element assemblages and analytics that describe and measure them. It enables instructors to understand what the analytics mean.

\ Fig. 4. Another example of scale and cluster recognition. The outermost scale comprises one cluster—including all design elements—which is rendered in yellow color. The next inner scale has seven clusters, which are rendered in blue. However, AI is not perfect. Here, the two clusters rendered in brown are incorrectly recognized to be at the next inner level, as their content is similarly legible as the content within the clusters rendered in blue.

\ an assignment page (see Figure 3 top) on the dashboard, it presents to them the students’ submissions and scale and cluster analytics derived through the AI analysis of submissions.

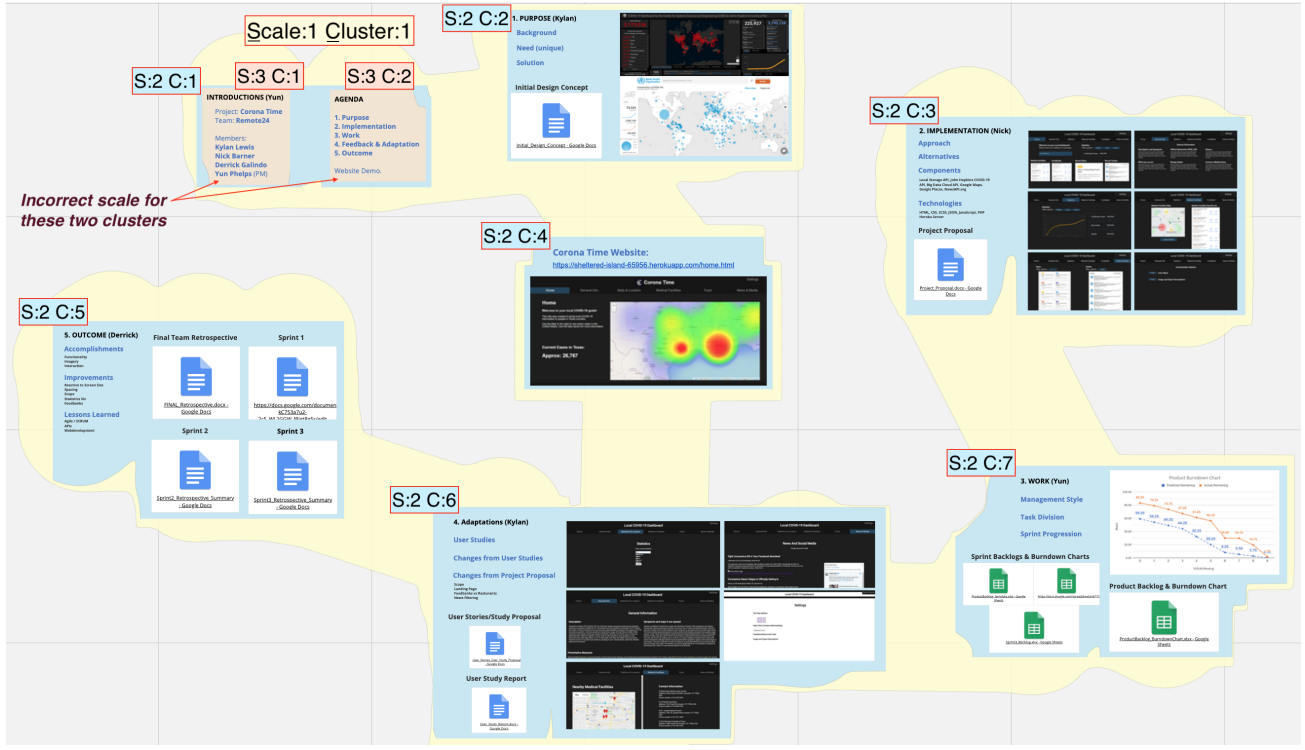
\ We link the dashboard presentation of the analytics with the specific design assemblages they measure. This makes results of AI recognition—for each instance of student design work—visible to the instructor (see Figure 3 bottom). When the instructor clicks a scale or cluster analytic, it opens the corresponding student design work instance within the multiscale design environment. An animation shows them the design assemblages for each scale and cluster. All clusters at the same scale are presented using the same background color, so as to help discern nested relationships (Figure 3 bottom, Figure 4).

\

:::info Authors:

(1) Ajit Jain, Texas A&M University, USA; Current affiliation: Audigent;

(2) Andruid Kerne, Texas A&M University, USA; Current affiliation: University of Illinois Chicago;

(3) Nic Lupfer, Texas A&M University, USA; Current affiliation: Mapware;

(4) Gabriel Britain, Texas A&M University, USA; Current affiliation: Microsoft;

(5) Aaron Perrine, Texas A&M University, USA;

(6) Yoonsuck Choe, Texas A&M University, USA;

(7) John Keyser, Texas A&M University, USA;

(8) Ruihong Huang, Texas A&M University, USA;

(9) Jinsil Seo, Texas A&M University, USA;

(10) Annie Sungkajun, Illinois State University, USA;

(11) Robert Lightfoot, Texas A&M University, USA;

(12) Timothy McGuire, Texas A&M University, USA.

:::


:::info This paper is available on arxiv under CC by 4.0 Deed (Attribution 4.0 International) license.

:::

\

Disclaimer: The articles reposted on this site are sourced from public platforms and are provided for informational purposes only. They do not necessarily reflect the views of MEXC. All rights remain with the original authors. If you believe any content infringes on third-party rights, please contact crypto.news@mexc.com for removal. MEXC makes no guarantees regarding the accuracy, completeness, or timeliness of the content and is not responsible for any actions taken based on the information provided. The content does not constitute financial, legal, or other professional advice, nor should it be considered a recommendation or endorsement by MEXC.

You May Also Like

Senate Bill Takes Aim at Officials Betting on Prediction Markets With Insider Information

Senate Bill Takes Aim at Officials Betting on Prediction Markets With Insider Information

The post Senate Bill Takes Aim at Officials Betting on Prediction Markets With Insider Information appeared on BitcoinEthereumNews.com. US Senators Todd Young,
Share
BitcoinEthereumNews2026/03/27 21:10
MoneyGram launches stablecoin-powered app in Colombia

MoneyGram launches stablecoin-powered app in Colombia

The post MoneyGram launches stablecoin-powered app in Colombia appeared on BitcoinEthereumNews.com. MoneyGram has launched a new mobile application in Colombia that uses USD-pegged stablecoins to modernize cross-border remittances. According to an announcement on Wednesday, the app allows customers to receive money instantly into a US dollar balance backed by Circle’s USDC stablecoin, which can be stored, spent, or cashed out through MoneyGram’s global retail network. The rollout is designed to address the volatility of local currencies, particularly the Colombian peso. Built on the Stellar blockchain and supported by wallet infrastructure provider Crossmint, the app marks MoneyGram’s most significant move yet to integrate stablecoins into consumer-facing services. Colombia was selected as the first market due to its heavy reliance on inbound remittances—families in the country receive more than 22 times the amount they send abroad, according to Statista. The announcement said future expansions will target other remittance-heavy markets. MoneyGram, which has nearly 500,000 retail locations globally, has experimented with blockchain rails since partnering with the Stellar Development Foundation in 2021. It has since built cash on and off ramps for stablecoins, developed APIs for crypto integration, and incorporated stablecoins into its internal settlement processes. “This launch is the first step toward a world where every person, everywhere, has access to dollar stablecoins,” CEO Anthony Soohoo stated. The company emphasized compliance, citing decades of regulatory experience, though stablecoin oversight remains fluid. The US Congress passed the GENIUS Act earlier this year, establishing a framework for stablecoin regulation, which MoneyGram has pointed to as providing clearer guardrails. This is a developing story. This article was generated with the assistance of AI and reviewed by editor Jeffrey Albus before publication. Get the news in your inbox. Explore Blockworks newsletters: Source: https://blockworks.co/news/moneygram-stablecoin-app-colombia
Share
BitcoinEthereumNews2025/09/18 07:04
Rubrik (RBRK) Stock Hits 52-Week Low as CFO Sells $5.9M in Stock

Rubrik (RBRK) Stock Hits 52-Week Low as CFO Sells $5.9M in Stock

TLDR Rubrik (RBRK) hit a new 52-week low of $46.00, last trading at $48.34 CFO Kiran Kumar Choudary sold 122,613 Class A shares for $5.9M on March 24 Q4 revenue
Share
Coincentral2026/03/27 21:18