

How Educators Use Multiscale Design Dashboards to Guide Creative and Technical Coursework
Table of Links
Abstract and 1. Introduction
-
Prior Work and 2.1 Educational Objectives of Learning Activities
2.2 Multiscale Design
2.3 Assessing Creative Visual Design
2.4 Learning Analytics and Dashboards
-
Research Artifact/Probe
3.1 Multiscale Design Environment
3.2 Integrating a Design Analytics Dashboard with the Multiscale Design Environment
-
Methodology and Context
4.1 Course Contexts
4.2 Instructor interviews
-
Findings
5.1 Gaining Insights and Informing Pedagogical Action
5.2 Support for Exploration, Understanding, and Validation of Analytics
5.3 Using Analytics for Assessment and Feedback
5.4 Analytics as a Potential Source of Self-Reflection for Students
-
Discussion + Implications: Contextualizing: Analytics to Support Design Education
6.1 Indexicality: Demonstrating Design Analytics by Linking to Instances
6.2 Supporting Assessment and Feedback in Design Courses through Multiscale Design Analytics
6.3 Limitations of Multiscale Design Analytics
-
Conclusion and References
A. Interview Questions
\
4 METHODOLOGY AND CONTEXT
We present a methodology of deploying the research artifact / probe in situated course contexts, gathering qualitative data through instructor interviews, and performing qualitative analysis with a methodology loosely based on Charmaz’s approach [19] to grounded theory. Grounded theory refers to a family of qualitative “constant comparative” research methods, which involve collecting data, through techniques such as observation and interviews, transcribing the data, unitizing the data, grouping the units based on common interpretations of what they mean, naming the groups (aka ‘coding’), and developing theory from codes and categories that emerge through this iterative process [12].
\ There are various methodological and philosophical approaches to grounded theory. As Birks and Mills articulate, among Charmaz’s contributions to the pool of grounded theory methodologies is “a focus on the place of the author in
\ 
\ the text, their relationship with participants, and the importance of writing…” [12]. We disclose our positionalities in this investigation. The technology developers also played a principal role in the gathering and analysis of data. Further, the developers worked not as detached scientific observers of the courses; rather, we worked in collaboration with instructors. Our collaboration involves the co-creation [66] of pedagogy, technological capability specifications, and interaction design. Both developers / qualitative researchers and instructors are among the authors of this paper.
4.1 Course Contexts
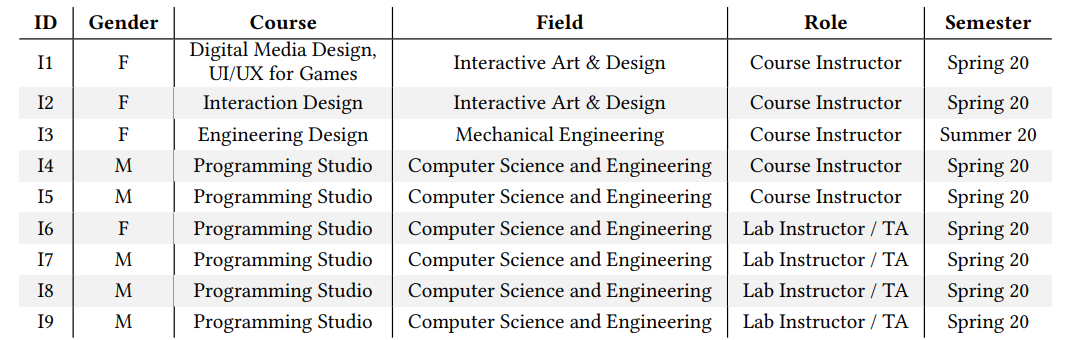
We investigated the research artifact / probe (Section 3.1) in 5 course instances, across three departments, during Spring and Summer 2020 (Table 1). These design course contexts are diverse. We contextualize the design tasks that students perform in these courses. In order to depict the creative work that students in this study are performing, which involves multiscale design, we first present overviews of each project. To detail the design tasks student perform through project phases, we then elaborate on I2’s project deliverables.
\ Instructors’ assessment plays a vital role, as students work through the project phases. Frequent assessment helps students in making continuous progress [57] and fulfilling project and overall course objectives. As project ideas and deliverables are organized within the multiscale design environment, it becomes a one-stop place for instructors to regularly monitor and assess student work. The integration of dashboard with the environment, thus, weaves multiscale design analytics into instructors’ situated contexts, in concert with their teaching and assessment processes.
\ 4.1.1 Assignment Overviews Across Fields. Here are overviews of multi-week assignment sequences in 5 course contexts, across fields (Table 1). The first two assignments are in Interactive Art and Design. The next is in Mechanical Engineering. The last two are in Computer Science and Engineering.
\ I1 (Interactive Art and Design): The students’ task is a team-based, 4-week game interface design project. Students research an assigned game genre and then sketch their own UI while keeping aesthetics in mind. The instructor introduces [the multiscale design environment (Section 3.1)] in the course, through which students organize and present at least 5 game examples, explanations for each on their UI design, mechanics, and any similarities. Alongside their sketches, students need to use text annotations, to explain their ideas and thought processes.
\ I2 (Interactive Art and Design): The students’ task is a team-based, 6-week interactive installation design project to improve people’s experiences of artworks. Students research, conceptualize, develop, evaluate, and present an interactive projection mapping based on physical computing techniques. The instructor introduces [the multiscale design environment] in the course, through which students organize and present inspirational ideas, the project description and plan, concept sketches, storyboards, and visuals of circuitry and interactive functionality.
\ I3 (Mechanical Engineering): The students’ task is a team-based, 2-week analogy formation project. Students identify a topic and then generate solutions by utilizing analogies across a semantic word tree. The instructor introduces [the multiscale design environment] in the course, through which students organize and present their topic, web searches, identified ideas, and analogy formation using the word tree method.
\ I4 and I5 (Computer Science and Engineering): The students’ task is a team-based, 6-week web application project. Students conceptualize, develop, evaluate, and present a mashup website, which needs to utilize at least three diverse web services. The instructors introduce [the multiscale design environment] in the course, through which students organize and present the project description, interface sketches, backlogs, burndown charts, findings from the user study, and videos of the functional product.
\ 4.1.2 I2’s Interactive Art and Design project deliverables. Here we elaborate on one of the projects. This project consists of 4 deliverables, due over 6 weeks, where students develop an interactive installation design project.
\ (1) Students perform technical and concept research, create a detailed project description and plan, and develop concept sketches and storyboards, while focusing on gestures, usability, and user experience. In [the multiscale design environment], they need to include at least three inspirational ideas, two interactive artworks, and types of inputs, outputs, and circuitry they plan to use.
\ (2) Students prepare their circuit connection, with an Android phone, using ProtoPie (a physical computing toolkit). In [the multiscale design environment], they need to include visuals that demonstrate a working connection.
\ (3) Students develop a lo-fidelity prototype for ProtoPie design, which should include color and typography. In [the multiscale design environment], they need to include visuals of the design and functionality.
\ (4) Students work on developing a hi-fidelity prototype, conducting a user study, and presenting their projects. In [the multiscale design environment], they include visuals showcasing users’ experiences with the prototype and the final presentation document.
4.2 Instructor interviews
The research artifact / probe was used by 5 design course instructors and four teaching assistants (TAs). We conducted semi-structured interviews with the professors and teaching assistants regarding their experiences at the end of the respective courses. We asked instructors regarding: whether the analytics dashboard showed them anything new about students’ learning; whether and how they utilized analytics for monitoring, intervening, and assessment and feedback; their thoughts on making analytics available to students on demand; and their understanding of analytics and how seeing analytics’ relationships with the actual design work affected their experiences. The complete set of interview questions can be seen in Appendix A.
\ Invoking Charmaz’s method for grounded theory qualitative data analysis [19], two authors first performed initial coding of three interview transcripts. They met to bring their initial codes into alignment, and formed tentative categories. Then, they performed focused coding of the remaining interview transcripts, revising codes and categories, as needed, to suitably represent the salient phenomena. We present the categories, including participant quotes illustrating the phenomena, in the next section.
\
:::info Authors:
(1) Ajit Jain, Texas A&M University, USA; Current affiliation: Audigent;
(2) Andruid Kerne, Texas A&M University, USA; Current affiliation: University of Illinois Chicago;
(3) Nic Lupfer, Texas A&M University, USA; Current affiliation: Mapware;
(4) Gabriel Britain, Texas A&M University, USA; Current affiliation: Microsoft;
(5) Aaron Perrine, Texas A&M University, USA;
(6) Yoonsuck Choe, Texas A&M University, USA;
(7) John Keyser, Texas A&M University, USA;
(8) Ruihong Huang, Texas A&M University, USA;
(9) Jinsil Seo, Texas A&M University, USA;
(10) Annie Sungkajun, Illinois State University, USA;
(11) Robert Lightfoot, Texas A&M University, USA;
(12) Timothy McGuire, Texas A&M University, USA.
:::
:::info This paper is available on arxiv under CC by 4.0 Deed (Attribution 4.0 International) license.
:::
\


You May Also Like

Cathie Wood’s ARK Invest Buys $13.7M in Circle Shares While Selling Robinhood Stock

The changing face of elder care in Malaysia — Sayed Mohammad Reza Yamani Sayed Umar

Not a loophole: Singapore AI export controls let China tap US AI legally


