As Bitcoin (BTC) tries to hold the $90,000 barrier, some analysts affirm that the flagship crypto’s bear market signals are becoming clearer, suggesting that a As Bitcoin (BTC) tries to hold the $90,000 barrier, some analysts affirm that the flagship crypto’s bear market signals are becoming clearer, suggesting that a

Bitcoin Bearish Signals Are ‘Hard To Ignore’: Analyst Warns Of Drop To April Lows

2025/12/13 20:00

As Bitcoin (BTC) tries to hold the $90,000 barrier, some analysts affirm that the flagship crypto’s bear market signals are becoming clearer, suggesting that a breakdown to new lows could be around the corner.

Bitcoin Bear Flag Raises Concerns

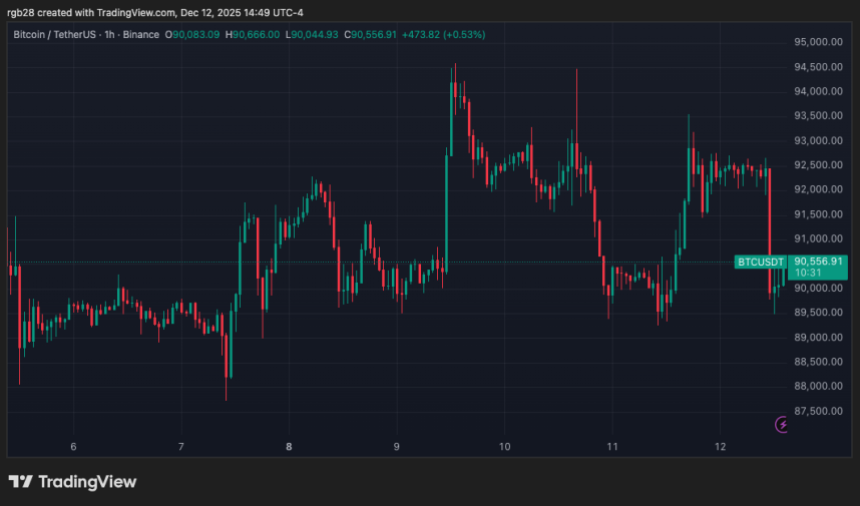
On Friday, Bitcoin shredded its Thursday gains, dropping 3.2% intraday to retest the $89,500-$90,500 support zone once again. The cryptocurrency has been trading between the $84,500-$94,500 range for the past four weeks, briefly falling to a seven-month low of $80,600 during the late November correction.

This week, the flagship crypto’s price has seen more volatility, fueled by the expectations of the Federal Reserve’s interest rate cut and positive regulatory developments in the US. However, BTC has failed to successfully break and hold above its local range’s upper boundary after multiple retests, ultimately falling to the mid-zone of its range.

Analyst Ted Pillows highlighted a concerning pattern on Bitcoin’s chart, warning that the cryptocurrency risks a drop to new multi-month lows if the price fails to hold key support levels.

Per the post, BTC has been forming a bear flag for nearly a month, which “is too hard to ignore” after the price continues to be rejected from the formation’s upper boundary. The analyst affirmed that this pattern follows a trend that has been developing over the past two months.

bitcoin

As he pointed out, bearish flags have been continuously forming on BTC’s chart since the October 10 market pullback, with each pattern resolving in a breakdown to lower levels. To Ted, the new formation signals “that the overall trend is still to the downside.”

He suggested that a close above the $96,000 level would invalidate the bearish pattern. On the contrary, a drop to below the $86,000 support, where the formation’s lower boundary is located, could push Bitcoin to the April lows, around the $76,000 mark.

Is The 2022 Playbook Repeating?

The market observer also noted a resemblance between the last cycle and the current one, which could lead to a drop below the $70,000 level. The chart shows that after losing the 50-Week EMA indications, Bitcoin consolidated within a bear flag before breaking down and descending to the 2022 lows.

Now, BTC displays a similar performance after losing the 50-Week EMA and breaking down from its October bear flag. “If this plays out, a pump to $100,000 and then a dump below $70,000” would follow, the analyst added.

Meanwhile, Robert Mercer shared a similar perspective in a series of X posts. The analyst affirmed that the classic four-year cycle has not changed despite the significant increase in institutional adoption:

He also asserted that Bitcoin shows a similar picture “from the 1W MA50 perspective,” as BTC has traded below this indicator for multiple weeks now for the first time in the bullish cycle.

Nonetheless, he concluded that “no such breakdown happens without a retest,” forecasting a relief bounce up to $98,000-$102,000, followed by a dump to the support level of $55,000-$60,000.

As of this writing, BTC Trades at $89,990, a 2.75% decline in the daily timeframe.

btc, bitcoin, btcusdt
Disclaimer: The articles reposted on this site are sourced from public platforms and are provided for informational purposes only. They do not necessarily reflect the views of MEXC. All rights remain with the original authors. If you believe any content infringes on third-party rights, please contact service@support.mexc.com for removal. MEXC makes no guarantees regarding the accuracy, completeness, or timeliness of the content and is not responsible for any actions taken based on the information provided. The content does not constitute financial, legal, or other professional advice, nor should it be considered a recommendation or endorsement by MEXC.

You May Also Like

Whales Dump 200 Million XRP in Just 2 Weeks – Is XRP’s Price on the Verge of Collapse?

Whales Dump 200 Million XRP in Just 2 Weeks – Is XRP’s Price on the Verge of Collapse?

Whales offload 200 million XRP leaving market uncertainty behind. XRP faces potential collapse as whales drive major price shifts. Is XRP’s future in danger after massive sell-off by whales? XRP’s price has been under intense pressure recently as whales reportedly offloaded a staggering 200 million XRP over the past two weeks. This massive sell-off has raised alarms across the cryptocurrency community, as many wonder if the market is on the brink of collapse or just undergoing a temporary correction. According to crypto analyst Ali (@ali_charts), this surge in whale activity correlates directly with the price fluctuations seen in the past few weeks. XRP experienced a sharp spike in late July and early August, but the price quickly reversed as whales began to sell their holdings in large quantities. The increased volume during this period highlights the intensity of the sell-off, leaving many traders to question the future of XRP’s value. Whales have offloaded around 200 million $XRP in the last two weeks! pic.twitter.com/MiSQPpDwZM — Ali (@ali_charts) September 17, 2025 Also Read: Shiba Inu’s Price Is at a Tipping Point: Will It Break or Crash Soon? Can XRP Recover or Is a Bigger Decline Ahead? As the market absorbs the effects of the whale offload, technical indicators suggest that XRP may be facing a period of consolidation. The Relative Strength Index (RSI), currently sitting at 53.05, signals a neutral market stance, indicating that XRP could move in either direction. This leaves traders uncertain whether the XRP will break above its current resistance levels or continue to fall as more whales sell off their holdings. Source: Tradingview Additionally, the Bollinger Bands, suggest that XRP is nearing the upper limits of its range. This often points to a potential slowdown or pullback in price, further raising concerns about the future direction of the XRP. With the price currently around $3.02, many are questioning whether XRP can regain its footing or if it will continue to decline. The Aftermath of Whale Activity: Is XRP’s Future in Danger? Despite the large sell-off, XRP is not yet showing signs of total collapse. However, the market remains fragile, and the price is likely to remain volatile in the coming days. With whales continuing to influence price movements, many investors are watching closely to see if this trend will reverse or intensify. The coming weeks will be critical for determining whether XRP can stabilize or face further declines. The combination of whale offloading and technical indicators suggest that XRP’s price is at a crossroads. Traders and investors alike are waiting for clear signals to determine if the XRP will bounce back or continue its downward trajectory. Also Read: Metaplanet’s Bold Move: $15M U.S. Subsidiary to Supercharge Bitcoin Strategy The post Whales Dump 200 Million XRP in Just 2 Weeks – Is XRP’s Price on the Verge of Collapse? appeared first on 36Crypto.
Share
Coinstats2025/09/17 23:42