Crypto Fear & Greed Index Plummets to 21: Navigating the Chilling Waters of Extreme Fear
BitcoinWorld
Crypto Fear & Greed Index Plummets to 21: Navigating the Chilling Waters of Extreme Fear
Global cryptocurrency markets entered a new phase of pronounced anxiety this week as the widely watched Crypto Fear & Greed Index registered a score of 21, solidifying a prolonged period of extreme fear among investors. This critical drop, reported by sentiment analytics firm Alternative, underscores the fragile psychological state of the digital asset ecosystem. Consequently, market participants now face a complex landscape defined by high volatility and cautious capital allocation.
The Crypto Fear & Greed Index Plunges into Extreme Fear Territory
The Crypto Fear & Greed Index serves as a crucial barometer for market psychology. It operates on a scale from 0 to 100. A score of 0 signifies maximum fear, while 100 indicates extreme greed. The current reading of 21 represents a two-point decline from the previous measurement. This firmly places market sentiment in the “extreme fear” zone, a condition historically associated with significant price corrections and investor capitulation. The index’s methodology relies on a sophisticated, multi-factor analysis to ensure a comprehensive view.
Specifically, it aggregates data from six primary sources. Market volatility and trading volume each contribute 25% to the final score. Social media sentiment and market surveys each account for 15%. Finally, Bitcoin’s dominance share of the total cryptocurrency market capitalization and relevant Google search trends each provide a 10% weighting. This composite approach helps filter out noise and identify genuine, underlying sentiment trends across different investor cohorts.
Decoding the Components Behind the Sentiment Shift
Several interrelated factors typically converge to drive the index into extreme fear. Firstly, increased price volatility often triggers the initial decline. Sharp, unpredictable price swings erode investor confidence and amplify uncertainty. Secondly, a noticeable drop in trading volume frequently accompanies this phase. Reduced activity suggests that both retail and institutional players are adopting a wait-and-see approach, withdrawing liquidity from the market.
Furthermore, social media analysis reveals a surge in negative commentary and fear-driven narratives. Online communities shift their focus from long-term potential to immediate risks and losses. Survey data from active traders often mirrors this pessimism, reflecting a broad-based expectation of further downside. Additionally, a rising Bitcoin dominance figure can signal a “flight to safety” within crypto, where capital exits altcoins for the perceived relative stability of Bitcoin, further depressing overall sentiment.
Historical Context and Comparative Analysis
Historically, periods of extreme fear have presented both significant risk and potential opportunity. For instance, during the market troughs of late 2018 and early 2020, the index repeatedly touched single-digit scores. Those periods preceded major market recoveries, though timing the exact bottom proved exceptionally difficult. A comparative timeline shows these fear cycles are a recurrent, if painful, feature of the volatile crypto asset class.
The table below illustrates key historical readings of the Crypto Fear & Greed Index and their market context:
| Index Score | Sentiment Zone | Approximate Period | General Market Context |
|---|---|---|---|
| 5-10 | Extreme Fear | Dec 2018 / Mar 2020 | Post-bear market lows, COVID-19 crash |
| 20-30 | Fear | Jun 2022 / Present | Sustained bear market, macroeconomic pressure |
| 40-60 | Neutral | Periods of consolidation | Low volatility, balanced sentiment |
| 70-80 | Greed | Q4 2020 / Q4 2021 | Strong bull market advances |
| 90+ | Extreme Greed | Early 2021 / Nov 2021 | Market peaks, FOMO-driven buying |
Potential Market Impacts and Investor Considerations
An extended period of extreme fear carries several practical implications. Primarily, it often correlates with depressed asset prices across the board. Many cryptocurrencies may trade significantly below their historical averages or network value metrics. This environment tests the conviction of long-term holders and can lead to forced liquidations for leveraged traders. Moreover, project development and funding can slow as market attention shifts from innovation to survival.
However, seasoned analysts note that such sentiment extremes can also create conditions for future gains. Valuations become detached from euphoria and may better reflect fundamental utility. For disciplined investors, it can be a period for strategic accumulation based on rigorous research, not emotion. The key considerations during this phase include:
- Risk Management: Prioritizing capital preservation over aggressive speculation.
- Fundamental Analysis: Assessing project health beyond price action.
- Macro Awareness: Understanding broader financial market conditions impacting liquidity.
- Emotional Discipline: Avoiding decisions driven purely by fear or the desire to “catch a falling knife.”
Ultimately, the Crypto Fear & Greed Index provides a snapshot, not a prophecy. It quantifies the present emotional temperature of the market, which is a powerful input for informed decision-making.
Conclusion
The Crypto Fear & Greed Index reading of 21 delivers a clear, data-driven message: extreme fear currently governs cryptocurrency market sentiment. This condition, stemming from volatility, reduced volume, and negative social discourse, presents a formidable challenge for all market participants. Historically, such depths of pessimism have marked cyclical lows, though recovery timelines remain uncertain. Navigating this environment demands a focus on fundamentals, rigorous risk management, and an understanding that market sentiment, while powerful, is ultimately a transient force. The index will continue to be a vital tool for gauging when the emotional tide begins to turn.
FAQs
Q1: What does a Crypto Fear & Greed Index score of 21 mean?
A score of 21 indicates the market is in a state of “extreme fear.” This suggests widespread pessimism among investors, typically driven by falling prices, high volatility, and negative news flow. It is a quantitative measure of collective market psychology.
Q2: How is the Crypto Fear & Greed Index calculated?
The index is calculated using six data points: volatility (25%), market volume (25%), social media sentiment (15%), surveys (15%), Bitcoin dominance (10%), and Google search trends (10%). These are combined to produce a single number from 0 (extreme fear) to 100 (extreme greed).
Q3: Is extreme fear a good time to buy cryptocurrency?
Historically, periods of extreme fear have often preceded market recoveries, leading some to view them as potential buying opportunities for long-term investors. However, it does not guarantee an immediate bottom, and any investment should be based on personal research, risk tolerance, and financial goals, not sentiment alone.
Q4: How often does the Crypto Fear & Greed Index update?
The index is updated daily, providing a near real-time gauge of market sentiment. This allows investors and analysts to track shifts in psychology as news and price action develop.
Q5: What is the difference between “fear” and “extreme fear” on the index?
The index categorizes scores broadly. A reading from 0-24 signifies “Extreme Fear,” 25-49 is “Fear,” 50-74 is “Greed,” and 75-100 is “Extreme Greed.” The move from fear to extreme fear indicates a significant intensification of negative sentiment and risk aversion in the market.
This post Crypto Fear & Greed Index Plummets to 21: Navigating the Chilling Waters of Extreme Fear first appeared on BitcoinWorld.


You May Also Like

The Chemistry of UV Resistance: How Titanium Dioxide Protects Against the California Sun
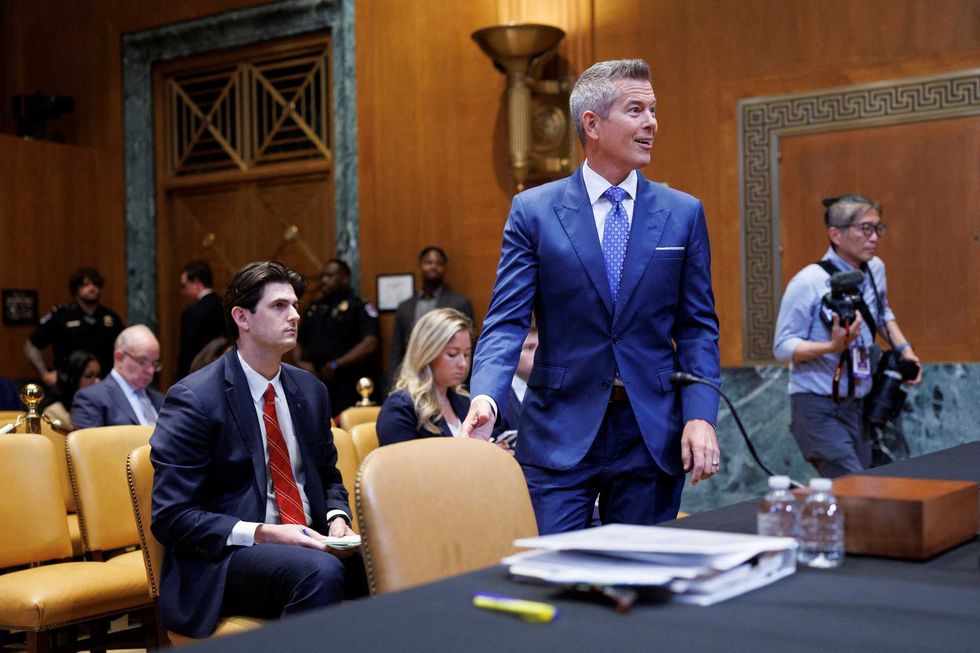
'You are wasting my time': Senator loses patience as Sean Duffy retorts 'Welcome to MAGA'