

Ethereum (ETH) Price Prediction 2026, 2027-2030
- Bullish ETH price prediction for 2026 is $3,484.34 to $4,278.00.
- Ethereum (ETH) price might reach $5,000 soon.
- Bearish ETH price prediction for 2026 is $2,117.71.
In this Ethereum (ETH) price prediction 2026, 2027-2030, we will analyze the price patterns of ETH by using accurate trader-friendly technical analysis indicators and predict the future movement of the cryptocurrency.
|
TABLE OF CONTENTS
|
|
INTRODUCTION
|
|
|
ETHEREUM (ETH) PRICE PREDICTION 2026
|
|
| ETHEREUM (ETH) PRICE PREDICTION 2027, 2028-2030 |
| CONCLUSION |
| FAQ |
Ethereum (ETH) Current Market Status
| Current Price | $3,237.47 |
| 24 – Hour Price Change | 1.86% Down |
| 24 – Hour Trading Volume | $24.56B |
| Market Cap | $390.8B |
| Circulating Supply | 120.69M ETH |
| All – Time High | $4,953.73 (On Aug 25, 2025) |
| All – Time Low | $0.4209(On Oct 22, 2015) |
What is Ethereum (ETH)
| TICKER | ETH |
| BLOCKCHAIN | Ethereum |
| CATEGORY | ERC-20 token |
| LAUNCHED ON | July 2015 |
| UTILITIES | Governance, Fast Transactions, gas fees & rewards |
Ethereum (ETH), known as Ether, is the native cryptocurrency of Ethereum. Ethereum is an open-source blockchain platform that revolutionized the blockchain and DeFi sector by the introduction of smart contracts. This second-generation blockchain was launched in 2015. Its native crypto coin, ether (ETH) was launched through an initial coin offering (ICO) in August 2014. The entire Ethereum network is fueled by Ether (ETH).
The blueprint of the Ethereum network was first released in its whitepaper in 2013 by Ethereum Co-founder Vitalik Buterin. Since its launch, the blockchain-based software platform functions as a potential launchpad for several other crypto tokens, DeFi protocols, and numerous decentralized applications (dApps). Thus, Ethereum is regarded as the “world computer.”
The smart contracts are coded programs that execute autonomously with pre-defined conditions on Ethereum. These smart contracts are deployed and executed via the Ethereum Vending Machine (EVM).
Ethereum has successfully transitioned to Proof-of-Stake (PoS) with The Merge completed on September 15, 2022. Originally built on the energy-intensive Proof-of-Work (PoW) system, Ethereum developers began preparing for this shift in 2020. However, the PoS upgrade reduces Ethereum’s energy consumption, as validators now stake ETH instead of mining. Additionally, this transition has turned Ether from an inflationary asset into a deflationary one, with reduced new ETH supply and transaction fee burns.
Ethereum 24H Technicals
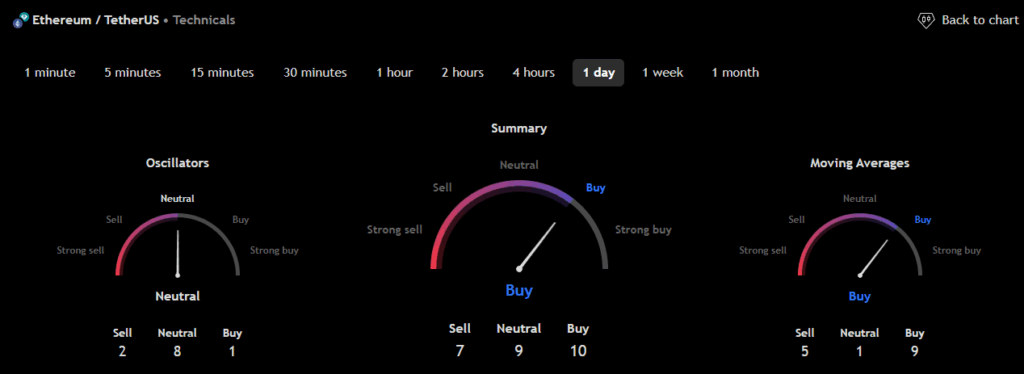 (Source: TradingView)
Ethereum (ETH) Price Prediction 2026
Ethereum (ETH) ranks 2nd on CoinMarketCap in terms of its market capitalization. The overview of the Ethereum price prediction for 2026 is explained below with a daily time frame.
In the above chart, Ethereum (ETH) laid out a descending channel pattern. Descending channel patterns are short-term bearish in that a stock moves lower within a descending channel, but they often form longer-term uptrends as continuation patterns. Higher prices often follow the descending channel pattern. But only after an upside penetration of the upper trend line. A descending channel is drawn by connecting the lower highs and lower lows of a security’s price with parallel trendlines to show a downward trend.
A trader could make a selling bet within a descending channel when the security price reaches its resistance trendline. An ascending channel is the opposite of a descending channel. Both ascending and descending channels are primary channels followed by technical analysts.
At the time of analysis, the price of Ethereum (ETH) was recorded at $3,237.47. If the pattern trend continues, then the price of ETH might reach the resistance levels of $3,264.73 and $4,716.41. If the trend reverses, then the price of ETH may fall to the support levels of $2,724.08.
Ethereum (ETH) Resistance and Support Levels
The chart given below elucidates the possible resistance and support levels of Ethereum (ETH) in 2026.
From the above chart, we can analyze and identify the following as resistance and support levels of Ethereum (ETH) for 2026.
| Resistance Level 1 | $3,484.34 |
| Resistance Level 2 | $4,278.00 |
| Support Level 1 | $2,615.04 |
| Support Level 2 | $2,117.71 |
ETH Resistance & Support Levels
Ethereum (ETH) Price Prediction 2026 — RVOL, MA, and RSI
The technical analysis indicators such as Relative Volume (RVOL), Moving Average (MA), and Relative Strength Index (RSI) of Bitcoin (ETH) are shown in the chart below.
From the readings on the chart above, we can make the following inferences regarding the current Ethereum (ETH) market in 2026.
| INDICATOR | PURPOSE | READING | INFERENCE |
| 50-Day Moving Average (50MA) | Nature of the current trend by comparing the average price over 50 days | 50 MA = $3,034.27Price = $3,226.07 (50MA < Price) |
Bullish/Uptrend |
| Relative Strength Index (RSI) | Magnitude of price change;Analyzing oversold & overbought conditions | 64.25 <30 = Oversold 50-70 = Neutral>70 = Overbought |
Neutral |
| Relative Volume (RVOL) | Asset’s trading volume in relation to its recent average volumes | Below cutoff line | Weak volume |
Ethereum (ETH) Price Prediction 2026 — ADX, RVI
In the below chart, we analyze the strength and volatility of Ethereum (ETH) using the following technical analysis indicators — Average Directional Index (ADX) and Relative Volatility Index (RVI).
From the readings on the chart above, we can make the following inferences regarding the price momentum of Ethereum (ETH).
| INDICATOR | PURPOSE | READING | INFERENCE |
| Average Directional Index (ADX) | Strength of the trend momentum | 21.70 | Weak Trend |
| Relative Volatility Index (RVI) | Volatility over a specific period | 81.73 <50 = Low >50 = High |
High volatility |
Comparison of ETH with BTC
Let us now compare the price movements of Ethereum (ETH) with that of Bitcoin (BTC), and Ethereum (ETH).
From the above chart, we can interpret that the price action of ETH is similar to that of BTC. That is, when the price of BTC increases or decreases, the price of ETH also increases or decreases, respectively.
Ethereum (ETH) Price Prediction 2027, 2028 – 2030
With the help of the aforementioned technical analysis indicators and trend patterns, let us predict the price of Ethereum (ETH) between 2027, 2028, 2029, and 2030.
| Year | Bullish Price | Bearish Price |
| Ethereum (ETH) Price Prediction 2027 | $12,000 | $2,000 |
| Ethereum (ETH) Price Prediction 2028 | $14,000 | $1,800 |
| Ethereum (ETH) Price Prediction 2029 | $16,000 | $1,600 |
| Ethereum (ETH) Price Prediction 2030 | $18,000 | $1,400 |
Conclusion
If Ethereum (ETH) establishes itself as a good investment in 2026, this year would be favorable to the cryptocurrency. In conclusion, the bullish Ethereum (ETH) price prediction for 2026 is $4,278.00. Comparatively, if unfavorable sentiment is triggered, the bearish Ethereum (ETH) price prediction for 2026 is $2,117.71.
If the market momentum and investors’ sentiment positively elevate, then Ethereum (ETH) might hit $5000. Furthermore, with future upgrades and advancements in the Ethereum ecosystem, ETH might surpass its current all-time high (ATH) of $4,953.73 and mark its new ATH.
FAQ
1. What is Ethereum (ETH)?
Ethereum or Ether (ETH) is the native cryptocurrency of Ethereum. Ethereum is a second-generation blockchain platform that launched in 2015. Ether (ETH) was launched in 2014.
2. Where can you buy Ethereum (ETH)?
Traders can trade Ethereum (ETH) on the following cryptocurrency exchanges such as Binance, WEEX, OKX, LBank, and Bybit.
3. Will Ethereum (ETH) record a new ATH soon?
With the ongoing developments and upgrades within the Ethereum platform, Ethereum (ETH) has a high possibility of reaching its ATH soon.
4. What is the current all-time high (ATH) of Ethereum (ETH)?
Ethereum (ETH) hit its current all-time high (ATH) of $4,953.73 on August 25, 2025.
5. What is the lowest price of Ethereum (ETH)?
According to CoinMarketCap, ETH hit its all-time low (ATL) of $0.4209 on October 22, 2015.
6. Will Ethereum (ETH) hit $5,000?
If Ethereum (ETH) becomes one of the active cryptocurrencies that majorly maintain a bullish trend, it might rally to hit $5,000 soon.
7. What will be the Ethereum (ETH) price by 2027?
Ethereum (ETH) price might reach $7,000 by 2027.
8. What will be the Ethereum (ETH) price by 2028?
Ethereum (ETH) price might reach $9,000 by 2028.
9. What will be the Ethereum (ETH) price by 2029?
Ethereum (ETH) price might reach $11,000 by 2029.
10. What will be the Ethereum (ETH) price by 2030?
Ethereum (ETH) price might reach $13,000 by 2030.
Top Crypto Predictions
PancakeSwap (CAKE) Price Prediction
Helium (HNT) Price Prediction
IOTA (IOTA) Price Prediction
Disclaimer: The opinion expressed in this article is solely the author’s. It does not represent any investment advice. TheNewsCrypto team encourages all to do their own research before investing.


You May Also Like

XRP Price Prediction Waits on CLARITY as Pepeto Presale Passes $8M in Silence

US Rises 6.46%, UK Hits 5.56%, EU 3.4%


