The post Bitcoin Price Faces Heavy Sell Pressure Near $94,000—Is the BTC Rally Losing Momentum? appeared first on Coinpedia Fintech News After printing consecutiveThe post Bitcoin Price Faces Heavy Sell Pressure Near $94,000—Is the BTC Rally Losing Momentum? appeared first on Coinpedia Fintech News After printing consecutive

Bitcoin Price Faces Heavy Sell Pressure Near $94,000—Is the BTC Rally Losing Momentum?

DOJ Bitcoin sale controversy

The post Bitcoin Price Faces Heavy Sell Pressure Near $94,000—Is the BTC Rally Losing Momentum? appeared first on Coinpedia Fintech News

After printing consecutive bullish candles, the Bitcoin bulls are facing some resistance, which is causing the price rise to stall. The token has been attempting to break the $94,000 barrier consistently since December but has thus far been unsuccessful. With this, it could appear that the momentum could be cooling off, but the BTC price remains above the key support zone. Therefore, with sellers defending overhead levels and buyers stepping in only on dips, the market is entering a critical decision phase.

Order Flow Shows Aggressive Sell Walls Above Price

Currently, the BTC price is trading around $92,000, after facing repeated rejection near this zone. While buyers continue to defend the downside, the latest order book and heatmap data suggest that sellers remain firmly in control at higher levels.

The order-flow heatmap highlights dense sell liquidity clusters between $94,500 and $96,000 on major exchanges, including Binance, Bitfinex, and Kraken. These sell walls have repeatedly absorbed buy pressure, preventing Bitcoin from sustaining a breakout.
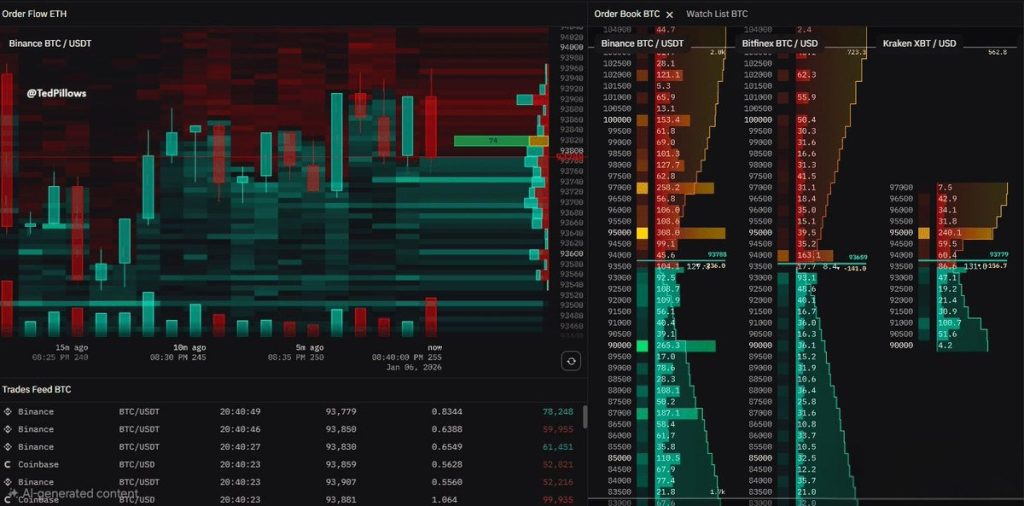
bitcoin priceSource: X

Large resting sell orders are visible just above $94,000, while cumulative asks increase sharply closer to $95,000. This explains why upward moves have stalled quickly despite multiple attempts. The trades feed shows consistent market buying near $93,500–$93,800, indicating that dip buyers are still active. However, this demand appears reactive rather than aggressive, stepping in only when the price pulls back instead of chasing higher levels. This behavior keeps BTC locked in a tight range, with neither side willing to fully commit.

The current liquidity distribution suggests a compression phase rather than a clean breakout setup. While downside liquidity below $92,000–$91,000 looks thinner compared to overhead resistance, buyers have so far managed to prevent a sharp breakdown.

From a market-structure perspective:

  • Above $94K: Heavy sell-side dominance
  • Below $92K: Buyers step in, but cautiously
  • Between $92K and $92K–$94K: Choppy, low-conviction trading

What This Means for Bitcoin Price Action

Order-flow data indicates that Bitcoin needs clear absorption of sell walls near $94,500–$95,000 to unlock further upside. Without that, price is likely to remain range-bound or face renewed rejection from overhead supply.

bitcoin price

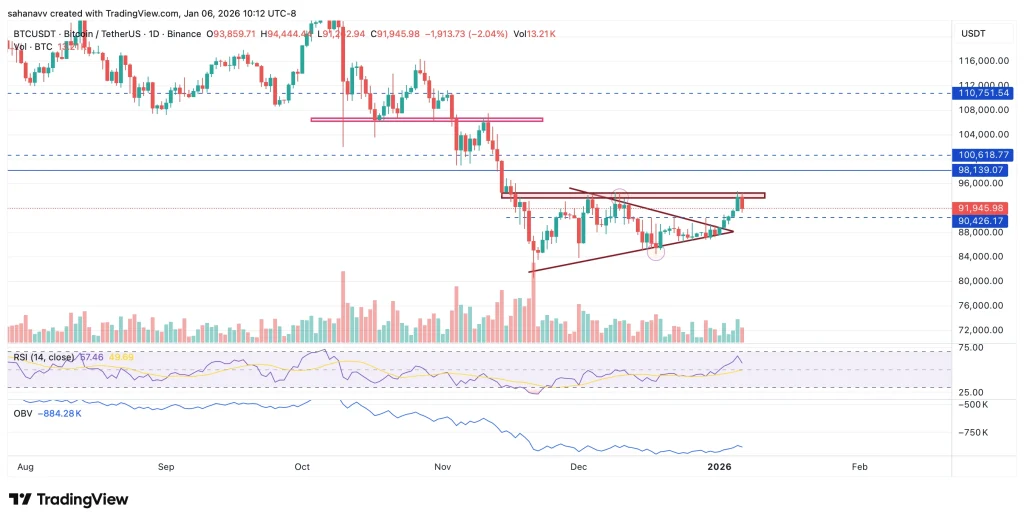
As seen in the above chart, after breaking the decisive symmetric triangle, the BTC price faced resistance between $93,500 and $94,500. The RSI and the OBV also displayed a sharp bearish divergence along with the price. This suggests the bullish momentum has stalled, and as the CMF remains under 0, no major liquidity is supporting the upswing. Therefore, the Bitcoin price is believed to remain consolidated below the resistance zone but defend the support zone at the 50-day MA around $89,200. 

The Bottom Line

From a trading perspective, Bitcoin remains capped below the $94,500–$95,000 supply zone, where repeated sell absorption is visible on the order-flow heatmap. A sustained break and acceptance above this region could open the door toward $98,000, followed by the psychological $100,600 level. On the downside, failure to hold $92,000 would expose BTC to a deeper pullback toward $90,400 and potentially $88,800, where buyers have previously stepped in. Until one of these levels gives way with volume, Bitcoin is likely to remain in a range-bound, high-volatility environment.

Market Opportunity
NEAR Logo
NEAR Price(NEAR)
$1.684
$1.684$1.684
-1.75%
USD
NEAR (NEAR) Live Price Chart
Disclaimer: The articles reposted on this site are sourced from public platforms and are provided for informational purposes only. They do not necessarily reflect the views of MEXC. All rights remain with the original authors. If you believe any content infringes on third-party rights, please contact service@support.mexc.com for removal. MEXC makes no guarantees regarding the accuracy, completeness, or timeliness of the content and is not responsible for any actions taken based on the information provided. The content does not constitute financial, legal, or other professional advice, nor should it be considered a recommendation or endorsement by MEXC.

You May Also Like

Myriad Moves: Traders Bet on Zcash Rebound, But Aren't Buying Another Bitcoin All-Time High

Myriad Moves: Traders Bet on Zcash Rebound, But Aren't Buying Another Bitcoin All-Time High

Top markets on Myriad this week include predictions on a new Bitcoin all-time high, Ethereum’s next move, and whether Zcash will bounce back.
Share
Coinstats2026/01/09 05:17
Non-Consensual AI Nudes: Governments Confront the Alarming Grok-Generated Flood on X

Non-Consensual AI Nudes: Governments Confront the Alarming Grok-Generated Flood on X

BitcoinWorld Non-Consensual AI Nudes: Governments Confront the Alarming Grok-Generated Flood on X San Francisco, January 2025 – A disturbing technological phenomenon
Share
bitcoinworld2026/01/09 06:35
3 Paradoxes of Altcoin Season in September

3 Paradoxes of Altcoin Season in September

The post 3 Paradoxes of Altcoin Season in September appeared on BitcoinEthereumNews.com. Analyses and data indicate that the crypto market is experiencing its most active altcoin season since early 2025, with many altcoins outperforming Bitcoin. However, behind this excitement lies a paradox. Most retail investors remain uneasy as their portfolios show little to no profit. This article outlines the main reasons behind this situation. Altcoin Market Cap Rises but Dominance Shrinks Sponsored TradingView data shows that the TOTAL3 market cap (excluding BTC and ETH) reached a new high of over $1.1 trillion in September. Yet the share of OTHERS (excluding the top 10) has declined since 2022, now standing at just 8%. OTHERS Dominance And TOTAL3 Capitalization. Source: TradingView. In past cycles, such as 2017 and 2021, TOTAL3 and OTHERS.D rose together. That trend reflected capital flowing not only into large-cap altcoins but also into mid-cap and low-cap ones. The current divergence shows that capital is concentrated in stablecoins and a handful of top-10 altcoins such as SOL, XRP, BNB, DOG, HYPE, and LINK. Smaller altcoins receive far less liquidity, making it hard for their prices to return to levels where investors previously bought. This creates a situation where only a few win while most face losses. Retail investors also tend to diversify across many coins instead of adding size to top altcoins. That explains why many portfolios remain stagnant despite a broader market rally. Sponsored “Position sizing is everything. Many people hold 25–30 tokens at once. A 100x on a token that makes up only 1% of your portfolio won’t meaningfully change your life. It’s better to make a few high-conviction bets than to overdiversify,” analyst The DeFi Investor said. Altcoin Index Surges but Investor Sentiment Remains Cautious The Altcoin Season Index from Blockchain Center now stands at 80 points. This indicates that over 80% of the top 50 altcoins outperformed…
Share
BitcoinEthereumNews2025/09/18 01:43