

Compression builds as XRP price holds 2.10 ahead of next major move

The market is coiling around the current XRP price near 2.10, with charts hinting at a bigger move ahead even as direction remains undecided.
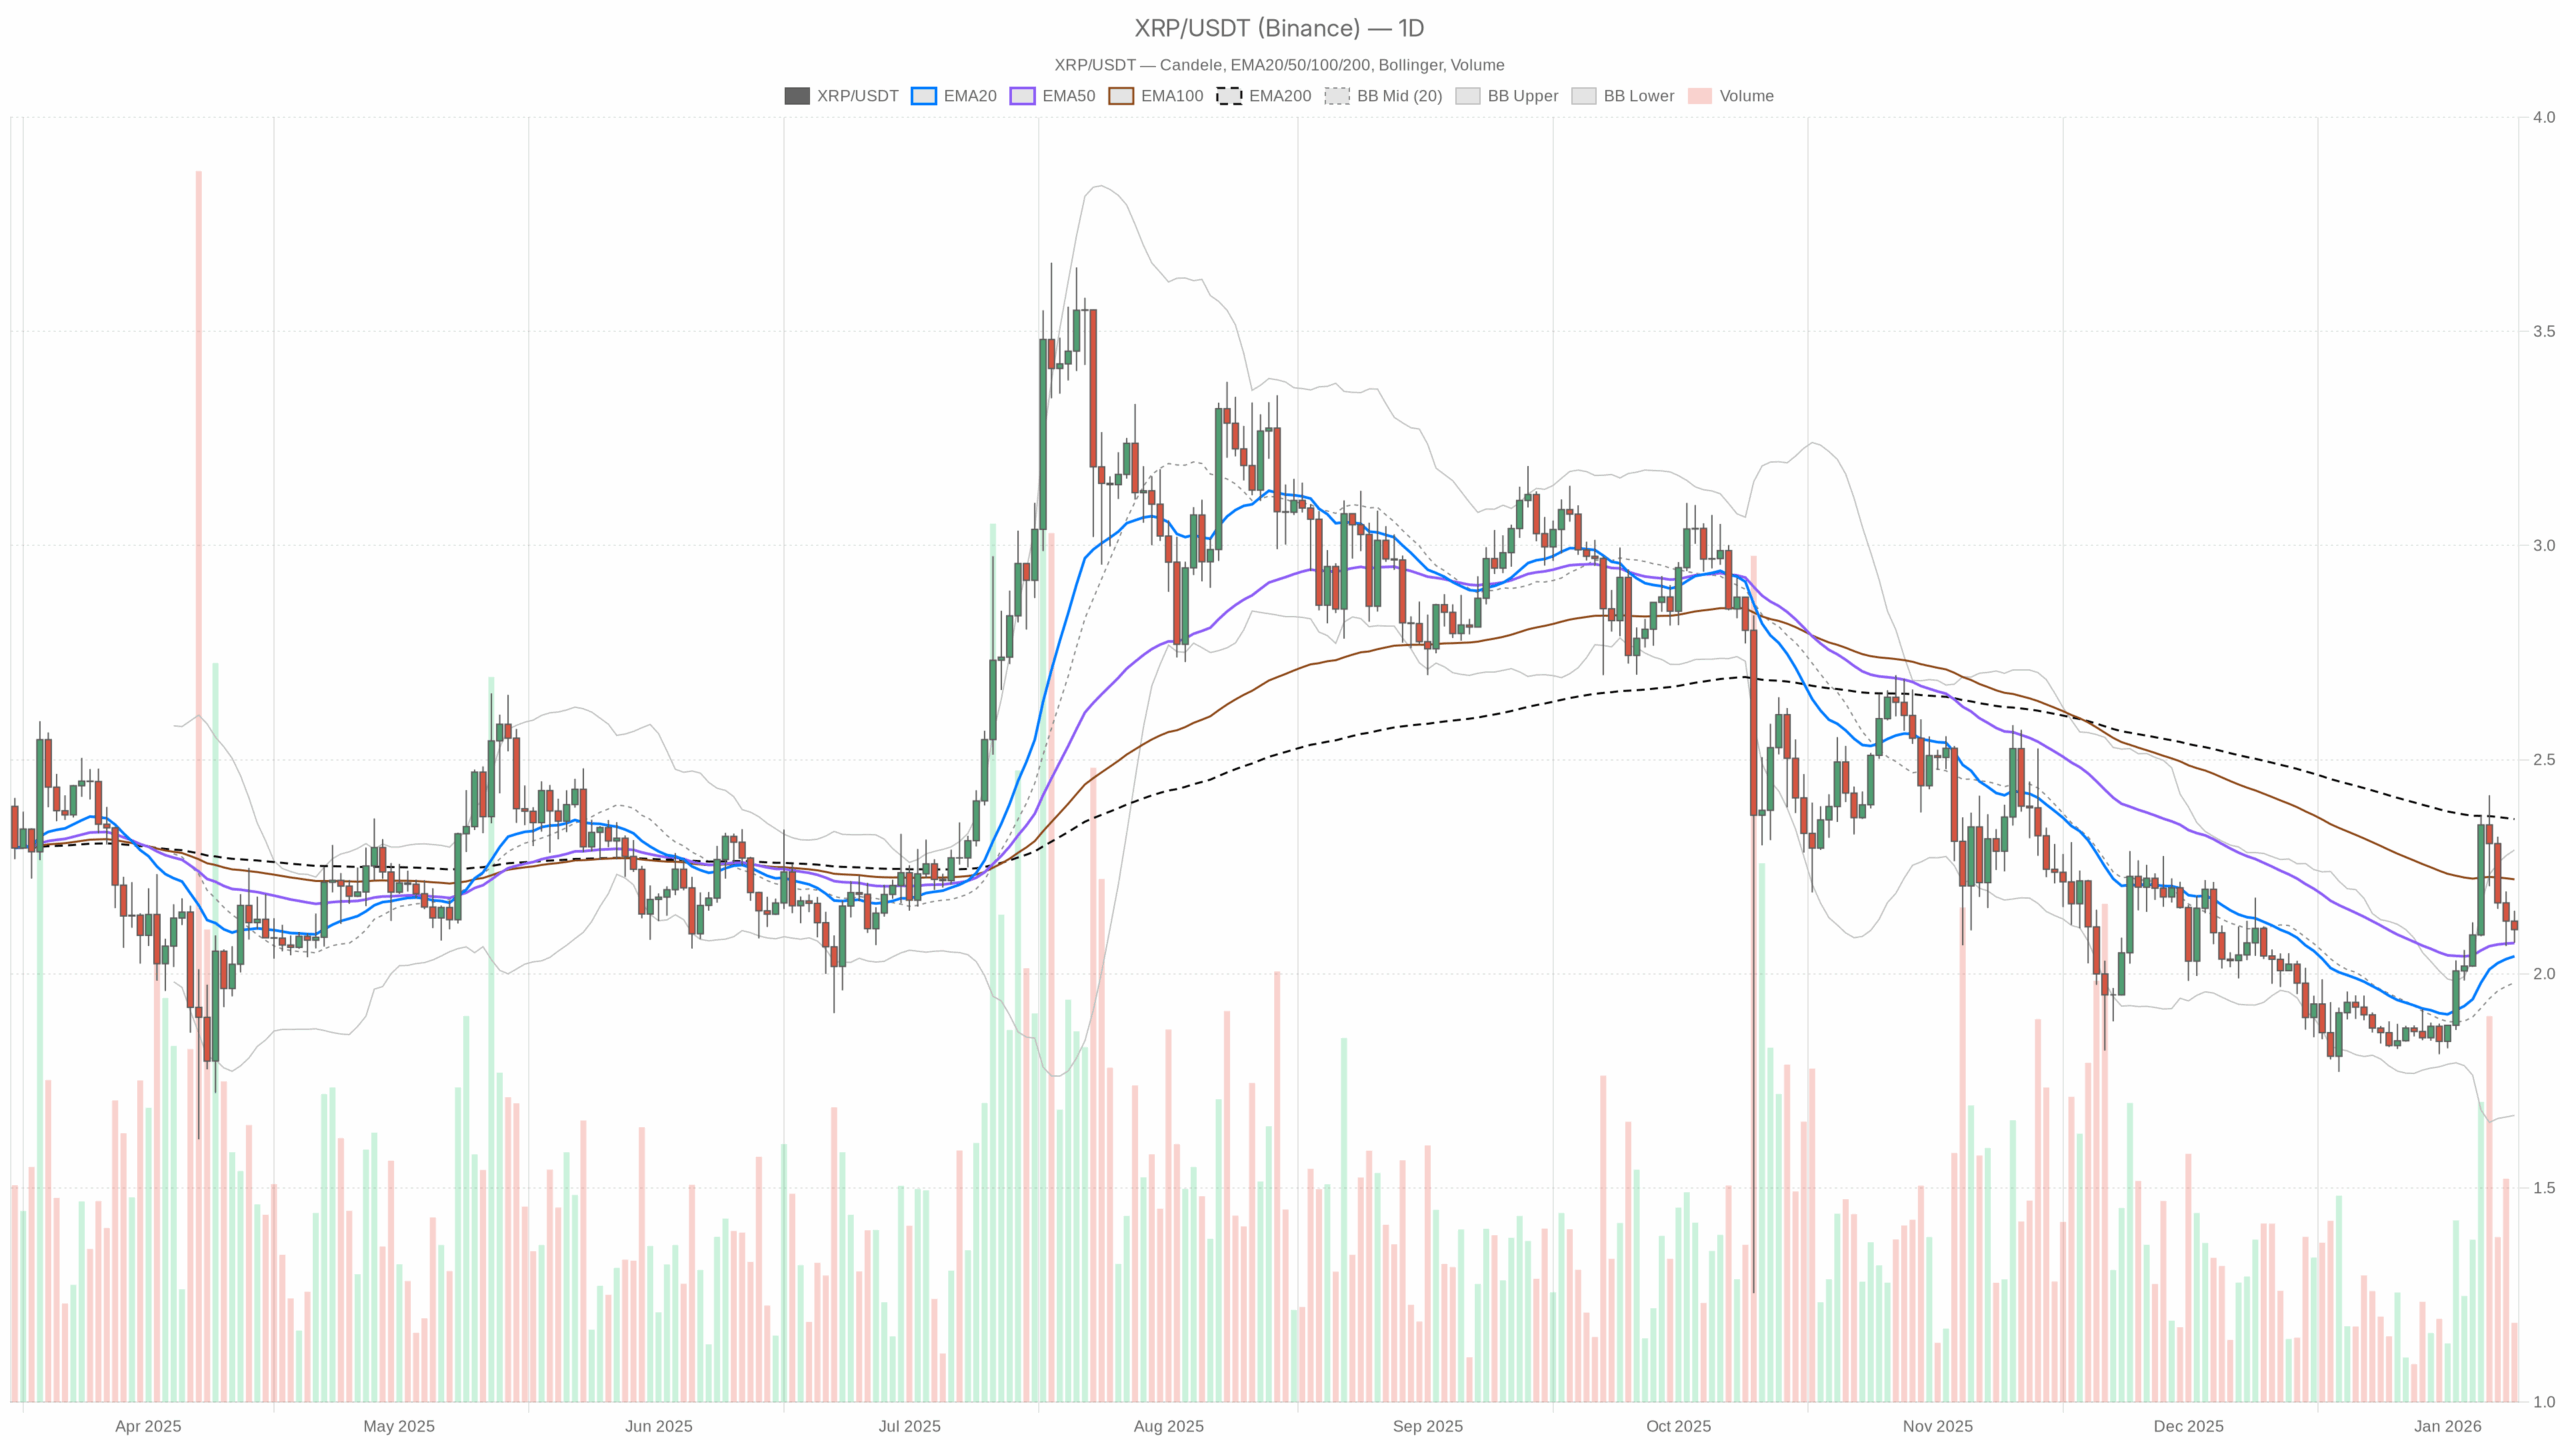 XRP/USDT — daily chart with candlesticks, EMA20/EMA50 and volume.
Daily Chart (D1): Macro Bias – Mild Bullish Within a Neutral Regime
The daily timeframe defines the macro bias, and right now it leans modestly to the upside but without trending conviction.
EMAs (Trend & Structure)
– Price: 2.10
– EMA 20: 2.04
– EMA 50: 2.07
– EMA 200: 2.36
XRP is trading above the 20- and 50-day EMAs, but below the 200-day EMA. Short term, buyers are in control; longer term, price is still under the big moving average that usually defines the cycle trend.
In practice, this is a classic recovery inside a bigger downtrend type of structure: supportive for swing longs as long as 2.00–2.05 holds, but still vulnerable to mean reversion toward the 200-day if the broader market rolls over.
RSI 14 (Momentum & Heat)
– RSI (14): 54.76
Daily RSI is sitting just above the midpoint.
This is neither overbought nor oversold; it reflects a minor bullish edge, but no momentum squeeze. There is room in both directions, which fits the idea of a coiled market rather than a blow-off.
MACD (Trend Momentum)
– MACD line: 0.05
– Signal line: 0.02
– Histogram: 0.03
The MACD is positive and slightly above the signal, with a modestly positive histogram.
That is consistent with a gentle bullish push, not a strong trend. Buyers have the edge, but if they stop pressing, this can flip back to flat very quickly.
Bollinger Bands (Volatility & Range)
– Middle band (20 MA): 1.98
– Upper band: 2.29
– Lower band: 1.67
– Price: 2.10
Price is sitting slightly above the middle band, comfortably inside the envelope.
This positioning says we are trading in the upper half of the recent volatility range, with no sign of a major squeeze or an extreme extension. Volatility is there, but not explosive – more like controlled compression before the next directional move.
ATR 14 (Daily Volatility)
– ATR (14): 0.11
An ATR of 0.11 on a 2.10 price means the typical daily range is about 5%.
That is meaningful but not euphoric volatility. For traders, it means a $0.10–0.12 swing either way on any given day is normal noise, not necessarily a trend change.
Daily Pivot Levels (Reference Levels)
– Pivot Point (PP): 2.11
– R1: 2.14
– S1: 2.07
Price is trading almost exactly at the daily pivot, slightly below 2.11.
Being pinned near the pivot underscores indecision: the market has yet to commit above 2.14 or below 2.07. Those short-term levels become important intraday decision points for continuation or rejection.
Daily Regime
– Regime: neutral
The system flags the daily regime as neutral, even though short-term EMAs and MACD lean higher.
This mismatch tells you the dominant force is not trend – it is balance. Bulls are nudging price upwards, but the broader structure still behaves like a trading range, not a clean trending phase.
Hourly Chart (H1): Confirmation – Soft Underbelly to the Daily Bias
The hourly chart should either back the daily bias or fight it. Here, it slightly undermines the mild bullish daily read.
EMAs (Short-Term Control)
– Price: 2.10
– EMA 20: 2.12
– EMA 50: 2.14
– EMA 200: 2.11
On H1, XRP trades below the 20- and 50-hour EMAs and slightly below the 200-hour.
Short term, sellers have nudged price under the local moving-average stack. This does not break the daily structure, but it caps upside attempts until buyers can reclaim at least 2.12–2.14 on a closing basis.
RSI 14 (Intraday Momentum)
– RSI (14): 43.83
Hourly RSI is under 50 but far from oversold.
Intraday, the tape is a bit heavy: dips are easier than pops right now, but bears are not in full control. This aligns with the idea of a mild corrective phase inside a bigger neutral range.
MACD (Hourly Momentum)
– MACD line: -0.01
– Signal line: -0.01
– Histogram: 0
The hourly MACD is essentially flat and slightly negative.
Momentum on this timeframe is dead in the water. There is no strong push either way; it is more of a drift slightly lower, which explains why price is slipping under the intraday EMAs without a sharp selloff.
Bollinger Bands (Hourly Range)
– Middle band: 2.12
– Upper band: 2.15
– Lower band: 2.09
– Price: 2.10
Price is near the lower half of the bands.
Intraday, XRP is testing the lower side of its short-term range. Unless it breaks decisively under 2.09, this still looks like range trade, not a breakdown.
ATR 14 (Hourly Volatility)
– ATR (14): 0.02
The hourly ATR of 0.02 on a 2.10 price is roughly 1% intraday swings as standard behavior.
This is relatively calm action for crypto; it implies that intraday breakouts need real volume to be trusted because the baseline noise is small.
Hourly Pivot Levels
– Pivot Point (PP): 2.10
– R1: 2.11
– S1: 2.10
Again, price is sitting directly on the pivot, with R1 and S1 tightly compressed.
Such tight levels reflect very low realized volatility in the short term. The first clean move away from this band (above 2.11 or under 2.09–2.10) is likely to draw in breakout traders.
Hourly Regime
– Regime: neutral
The hourly regime is also neutral.
So while the daily tilts bullish, the hourly is in wait mode – neither confirming a breakout nor signaling a serious unwind.
15-Minute Chart (M15): Execution Context – Micro-Ranging at 2.10
The 15-minute chart is for timing, not for defining bias. Right now, it is echoing the same indecision.
EMAs (Very Short-Term)
– Price: 2.10
– EMA 20: 2.10
– EMA 50: 2.11
– EMA 200: 2.15
Price is pinned to the 20-EMA, slightly below the 50-EMA, and noticeably below the 200-EMA.
Micro-structure is flat with a tiny bearish lean. This is the kind of tape where scalpers fade small moves rather than chase them, until a stronger impulse appears.
RSI 14 (Micro-Momentum)
– RSI (14): 47.51
RSI is almost exactly neutral.
No real edge intraday; the market is content to chop around 2.10 while waiting for a higher-timeframe catalyst.
MACD (Short-Term)
– MACD line: -0.01
– Signal line: -0.01
– Histogram: 0
Again, flat MACD with no separation between line and signal.
Momentum is paused. Any quick spike is more likely to be order-flow driven than a sustained trend on this timeframe.
Bollinger Bands & ATR (Noise Zone)
– Middle band: 2.10
– Upper band: 2.11
– Lower band: 2.09
– ATR (14): 0.01
Bands are tight and price is hugging the middle with an ATR of only $0.01.
On the 15-minute chart, nearly everything inside the 2.09–2.11 band is just noise. Breakouts from this micro-range need confirmation from H1 and D1 to matter.
Macro Context: Market Fear vs XRP Resilience
The broader crypto market is in Fear with a sentiment score of 27, yet total market cap is up slightly on the day (~0.65%), and Bitcoin dominance is high at ~57%.
This tells you capital is defensive, clustering in majors, but still participating on the upside. XRP, with a roughly 4% share of total crypto market cap, is behaving like a secondary large-cap: not leading the charge, but not being dumped either.
In that context, XRP’s position above its short-term daily EMAs while intraday charts drift sideways is relatively constructive. It means that unless the macro tape deteriorates sharply, dips toward the low 2s are more likely to be traded as mean reversion than full-blown trend reversals, at least on first touch.
Scenarios for XRP Price
Base Case Bias: Cautiously Bullish (From D1)
The daily chart carries a modest bullish lean: price above the 20/50-day EMAs, MACD positive, RSI slightly above neutral, and price trading in the upper half of the Bollinger band structure. However, the neutral regime flag and a still-distant 200-day EMA at 2.36 remind us the bigger trend is not yet fully reclaimed.
Bullish Scenario for XRP
Logic: Trend-following buyers gradually gain control, turning the current consolidation into a higher base.
What needs to happen:
- On D1: XRP holds above 2.05–2.07 (near S1 and the 20/50-day EMAs) on closing basis.
- On H1: Price reclaims and sustains above 2.12–2.14, pulling back above the hourly 20/50 EMAs and R1.
- RSI on D1 grinds higher into the 60s, and MACD histogram expands further positive, indicating real follow-through.
- Price presses toward the upper Bollinger band on D1 (~2.29) and starts challenging the 200-day EMA at 2.36.
Upside targets on this path: first the daily upper band around 2.25–2.30, then a test of the 200-day EMA region near 2.35–2.40. A clean break and daily close above the 200-day would convert this from a recovery to a more convincing uptrend.
Invalidation of the bullish case:
- A decisive daily close below 2.05 that drags price under both the 20- and 50-day EMAs.
- Daily RSI losing the 50 level and slipping into the 40s with MACD turning negative.
- Price gravitating toward the middle-to-lower half of the Bollinger bands (sub-1.98) and staying there.
If those conditions appear, the chart flips from bullish consolidation to failed attempt at higher.
Bearish Scenario for XRP
Logic: The broader market’s risk-off tone finally spills over, and XRP’s short-term strength gives way to a deeper mean reversion.
What needs to happen:
- On H1, XRP fails repeatedly at 2.12–2.14, with EMAs rolling down and hourly RSI camping below 40.
- Price breaks and closes below 2.07 (daily S1) and starts living near or below the daily middle Bollinger band at 1.98.
- Daily MACD crosses back toward or under zero, and RSI slides toward 40 or lower, signaling that selling pressure is gaining structure, not just noise.
Downside zones on this path: first, a re-test of the mid-band and psychological area around 2.00, and if that fails, a deeper probe toward the lower half of the recent volatility range between 1.80–1.85. The lower Bollinger band at 1.67 would be a more extreme extension in a sharper risk-off flush.
Invalidation of the bearish case:
- Swift reclaim of 2.14+ on H1 with strong candles and volume.
- Price re-aligning above the intraday EMAs, with hourly and 4H RSI back above 50.
- Daily closes back above the pivot and sustained trading in the upper band region (above ~2.20).
In that situation, shorts would be fighting an increasingly trend-like move higher.
Neutral / Range-Bound Scenario
Given the neutral regime readings across all timeframes, a strictly sideways scenario remains very plausible for the XRP price in the near term.
What it looks like: XRP oscillates between roughly 2.00 and 2.20, flipping intraday sentiment back and forth without committing to a breakout or breakdown. Daily RSI stays near 50–55, MACD hovers close to zero, and price keeps gravitating around the daily pivot region.
What would end the range: A strong daily close outside that 2.00–2.20 band, accompanied by expanding ATR and directional MACD, would likely signal that the range is resolved and a new leg (up or down) is underway.
How to Think About Positioning Right Now
XRP is not in a runaway trend; it is in a controlled consolidation with a slight bullish skew on the daily chart and a soft, indecisive tone on intraday charts. Volatility is moderate on D1 and quite low intraday, so apparent moves on 15-minute or hourly candles can be deceptive.
The key tensions to monitor:
- 2.05–2.07 support vs. 2.12–2.14 resistance: This is the immediate battleground. A sustained break either way will likely define the next leg.
- Daily EMAs vs. 200-day EMA: Holding above the 20/50-day is constructive, but the real test of trend strength comes at the 200-day around 2.36.
- Sentiment spillover: With the broader market in Fear, any macro shock can quickly flip XRP from a calm range into a sharper move, especially to the downside.
From a risk perspective, the current structure rewards patience more than aggression. Both bulls and bears have clear technical lines in the sand. Until those levels are broken with conviction and expanding volatility, this remains a trader’s market, not a forced-chase environment.
If you want to monitor markets with professional charting tools and real-time data, you can open an account on Investing.com using our partner link:
Open your Investing.com account
This section contains a sponsored affiliate link. We may earn a commission at no additional cost to you.
Disclaimer: This analysis is for informational and educational purposes only. It is not investment, trading, or financial advice, and it should not be used as the sole basis for any investment decision. Digital assets are highly volatile and carry a substantial risk of loss. Always conduct your own research and consider your risk tolerance before committing capital.


You May Also Like

DOT Technical Analysis Apr 25

Trump suddenly reverses course on Iran peace talks: 'Too much work!'


