

Market pause around $3,100 as traders weigh the next move for Ethereum ETH price


Markets are in a waiting phase, with Ethereum ETH price hovering near $3,100 while traders assess whether this pause resolves into a new leg higher or lower.
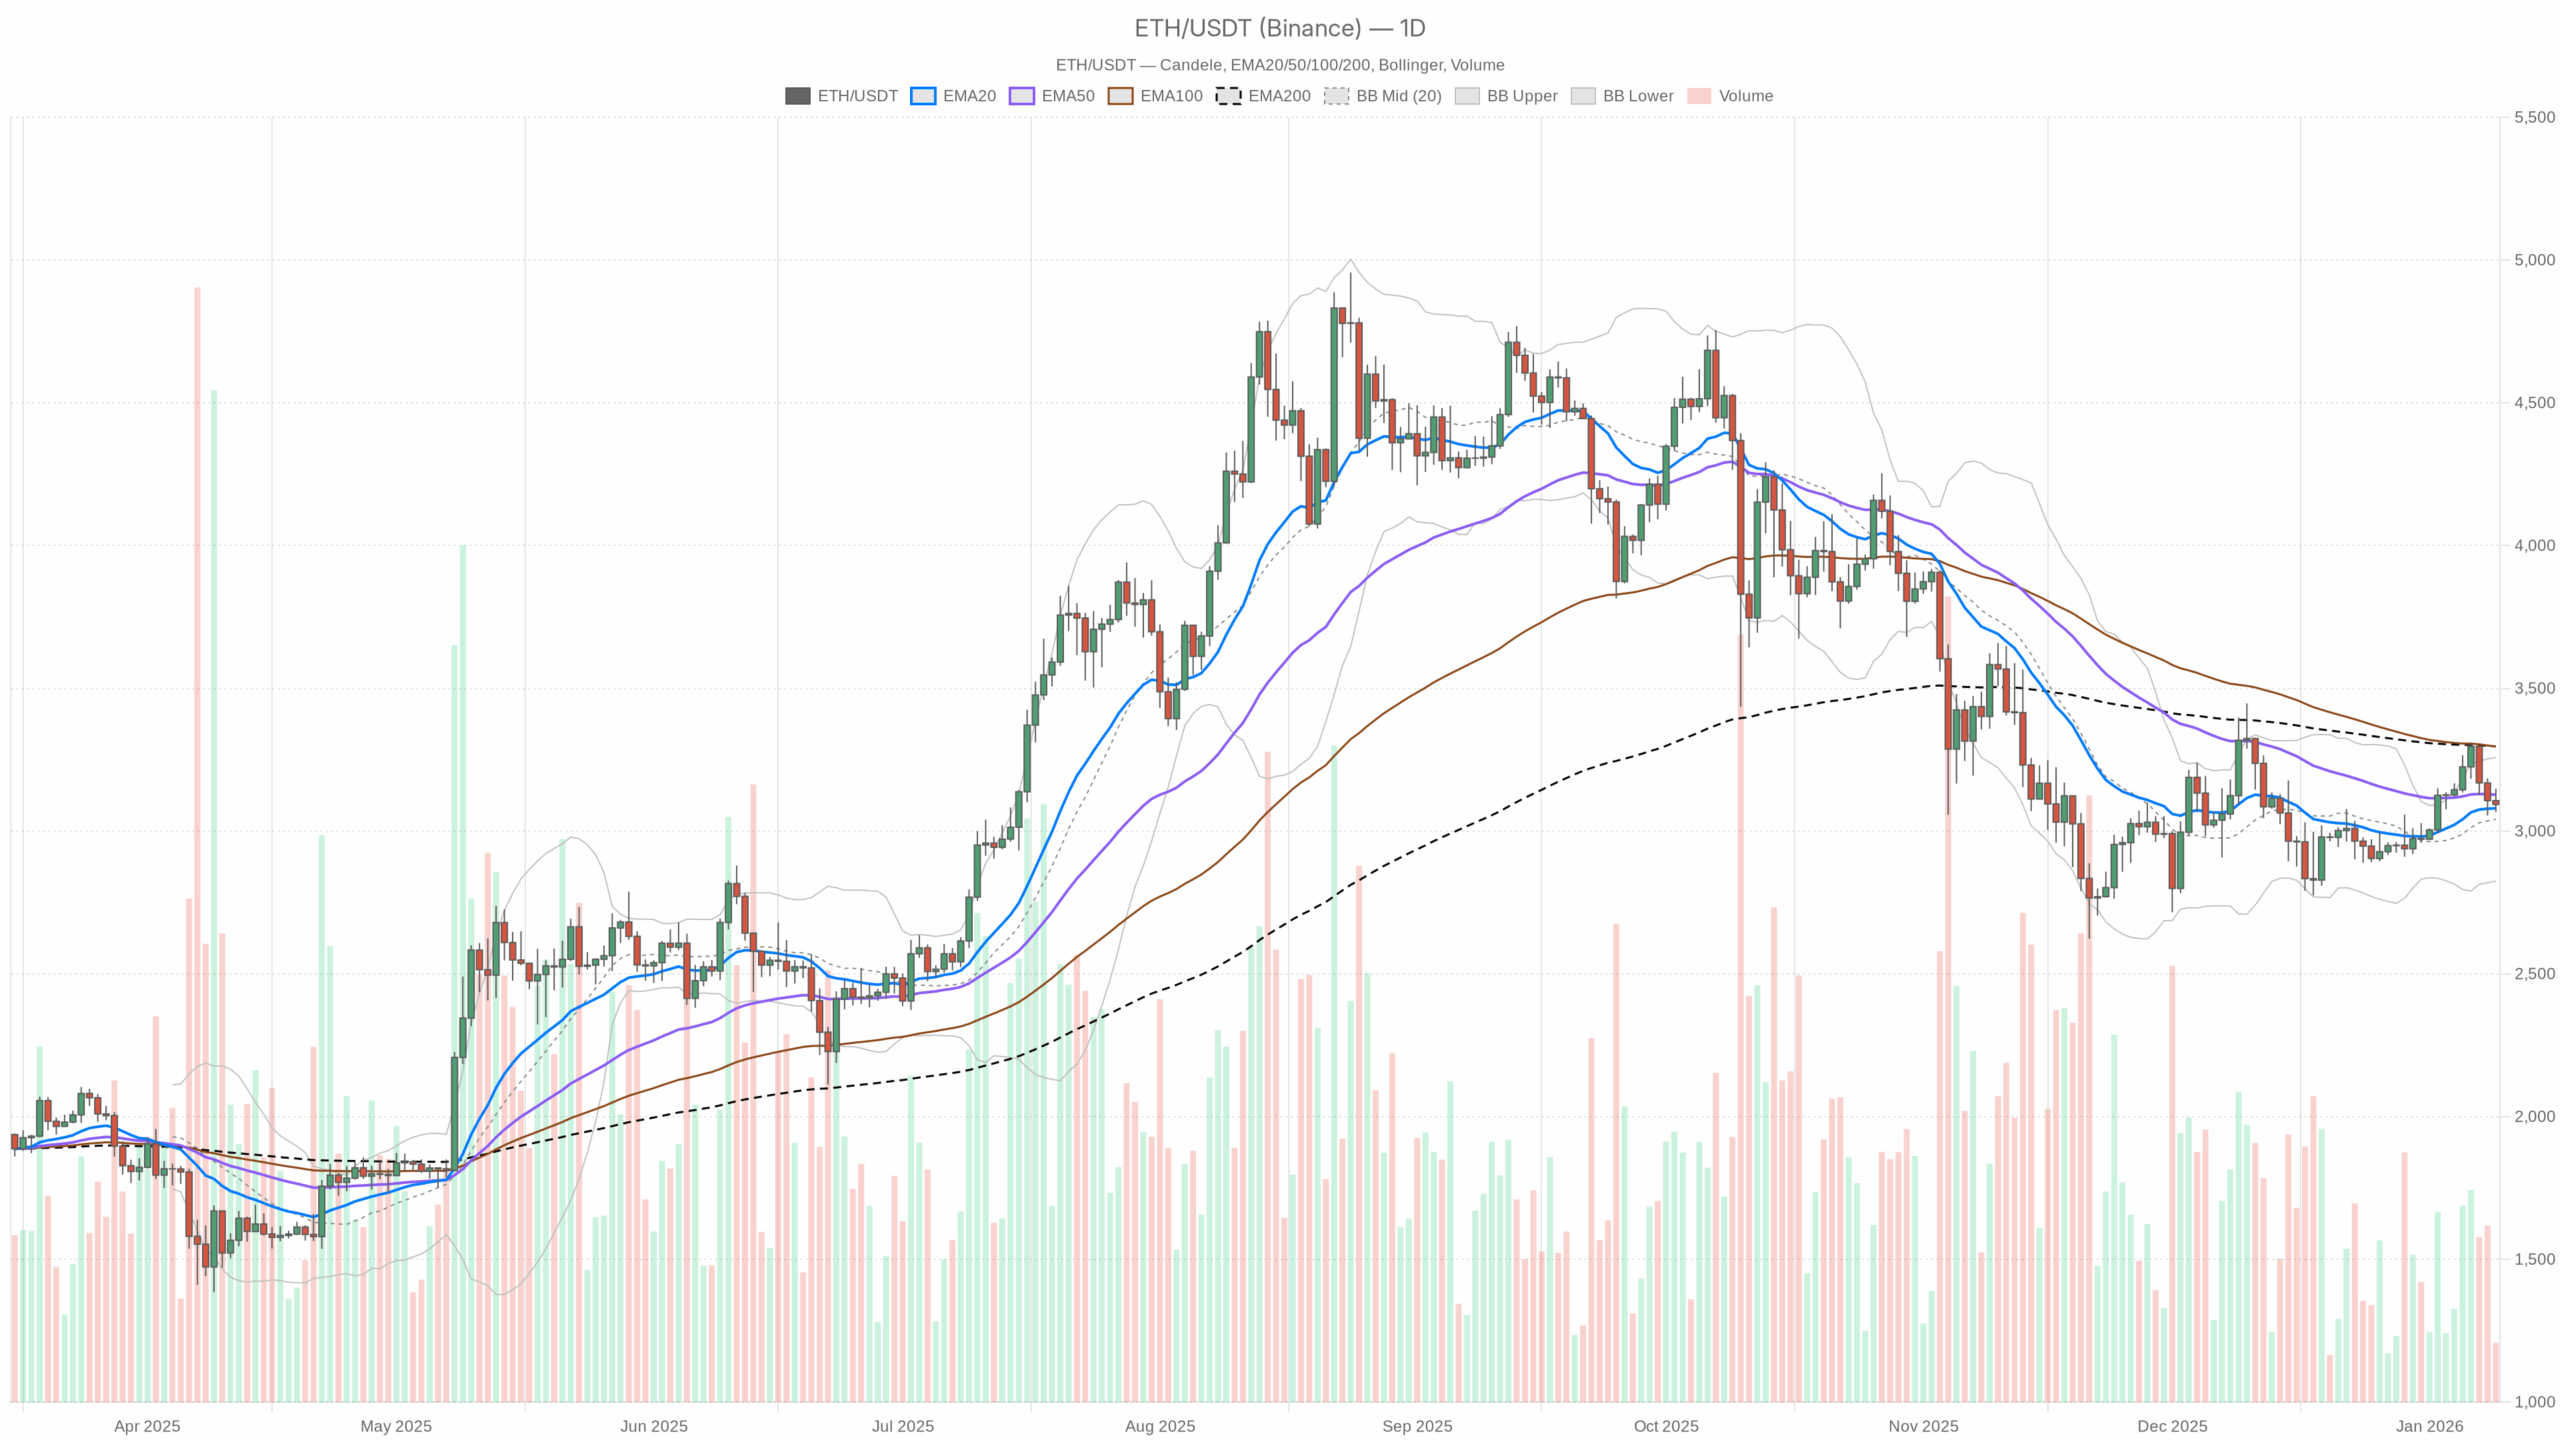 ETH/USDT — daily chart with candlesticks, EMA20/EMA50 and volume.
Daily chart (D1): main scenario and big picture
The daily timeframe defines the primary bias. On D1, ETH is in a neutral-to-slightly-constructive regime, with the price just above short-term trend references but still below the larger ones.
Daily moving averages (EMA 20 / 50 / 200)
• Price: $3,093.44
• EMA 20: $3,079.92
• EMA 50: $3,127.64
• EMA 200: $3,296.71
Reading: ETH is trading slightly above the 20-day EMA, but below the 50-day and well below the 200-day. That is the textbook structure of a market that has bounced from lows but is still stuck inside a broader corrective or early-recovery phase. Short-term buyers have some control, but the medium and long-term trend structures remain heavy.
In practice, it means the first real test for bulls is reclaiming the $3,120–3,150 area (around the 50-day EMA). Failure there keeps ETH in a choppy mean-reversion environment rather than a clean uptrend.
Daily RSI (14)
RSI 14 (D1): 51.48
Reading: RSI just above 50 says momentum is balanced with a slight bullish lean. This is not trending behavior; it is consolidation. There is no exhaustion on either side: sellers have not pushed ETH into oversold conditions, and buyers have not been aggressive enough to stretch it toward overbought.
In plain terms, daily momentum is neutral. The market is waiting for a catalyst to decide whether this is a continuation of the previous down leg or the start of a more meaningful recovery.
Daily MACD
• MACD line: 33.41
• Signal line: 15.77
• Histogram: +17.64
Reading: The MACD line is above the signal line and the histogram is positive, showing a recent bullish momentum cross on the daily. However, the values are not extreme, and they are occurring while price still sits under the 50- and 200-day EMAs.
That usually describes a counter-trend or early-trend bounce rather than a fully confirmed uptrend. Bulls have wrestled back some control for now, but they still need follow-through above resistance to prove this is more than just a relief rally.
Daily Bollinger Bands
• Middle band (20-day basis): $3,041.56
• Upper band: $3,258.11
• Lower band: $2,825.02
• Price: $3,093.44
Reading: ETH is trading just above the mid-band, in the upper half of the Bollinger range but not near the top. Bands are relatively wide, reflecting prior volatility, but price is not hugging either side.
That is consistent with a range-trading, mean-reversion environment. Buyers have managed to pull ETH off the lower band zone, but they have not been strong enough to pressure the upper band and kick off a volatility expansion to the upside.
Daily ATR (14)
ATR 14 (D1): $95.10
Reading: A roughly $95 daily ATR at a $3,000+ price marks moderate volatility. That is enough range for meaningful intraday swings but not a panic or blow-off environment. It supports the idea that ETH is in a controlled, choppy correction rather than in a high-volatility trend phase.
Daily pivot levels
• Pivot point (PP): $3,103.10
• First resistance (R1): $3,138.75
• First support (S1): $3,057.78
• Current price: $3,093.44
Reading: ETH is trading just below the daily pivot, effectively stuck around fair value for today’s range. The immediate intraday battle is between $3,060 (S1 zone) as support and $3,135–3,140 (R1 + 50-day EMA region) as resistance.
This alignment reinforces the idea of a market pausing at equilibrium, waiting for new information before choosing direction.
Daily regime & main bias
D1 regime: neutral
Reading: With price near the 20-day EMA, below the 50/200-day, RSI around 51, and a modestly bullish MACD, the main scenario on D1 is neutral with a slightly bullish tilt. This is not an aggressive trending environment. It is a market where both sides can make money, but position sizing and timing matter a lot.
Hourly chart (H1): short-term structure and momentum
H1 moving averages (EMA 20 / 50 / 200)
• Price: $3,093.99
• EMA 20: $3,105.85
• EMA 50: $3,130.44
• EMA 200: $3,124.20
Reading: On the hourly chart, price is trading below all three EMAs. The short, medium, and long intraday trend references are stacked above price, a clear sign of short-term downside pressure or a pullback within the larger daily consolidation.
So, while the daily chart is neutral-to-slightly positive, the 1-hour chart is leaning bearish in the very near term. That creates tension between timeframes: swing traders may see a forming base, while shorter-term traders are still selling into minor intraday rallies.
H1 RSI (14)
RSI 14 (H1): 43.12
Reading: An RSI around 43 on the hourly says bearish bias but not oversold. Bears have the edge intraday, but there is no sign of capitulation or exhaustion yet. It fits the idea of a controlled drift lower inside a broader range, not a waterfall.
H1 MACD
• MACD line: -11.20
• Signal line: -10.75
• Histogram: -0.45
Reading: The MACD is negative and the histogram is slightly below zero, indicating weak but active downside momentum. The selling pressure is present, but not strong enough to call it a trend day to the downside.
Intraday, this aligns with a sell rallies into resistance mindset until the MACD and EMAs start to turn back up.
H1 Bollinger Bands
• Middle band: $3,107.21
• Upper band: $3,132.10
• Lower band: $3,082.31
• Price: $3,093.99
Reading: Price is sitting just below the middle band, a bit closer to the lower side, inside relatively tight bands. That points to a mild intraday down-bias with compressed volatility. It is not the kind of setup where you expect explosive moves without new catalysts.
H1 ATR (14)
ATR 14 (H1): $20.06
Reading: An hourly ATR around $20 reflects modest intraday ranges. ETH is moving, but it is not a high-volatility session. This typically favors short-term mean-reversion trades inside clearly defined support and resistance rather than breakout attempts.
H1 pivot levels
• Pivot point (PP): $3,090.58
• First resistance (R1): $3,097.72
• First support (S1): $3,086.85
• Price: $3,093.99
Reading: On the hourly, ETH is trading just above the pivot point and between very tight intraday levels. It is a micro-range: a few dollars either side can flip control between buyers and sellers.
Given the EMA stack above, the path of least resistance on short timeframes is still slightly down or sideways unless price can reclaim the $3,105–3,110 area and hold it.
15-minute chart (M15): execution context
M15 moving averages (EMA 20 / 50 / 200)
• Price: $3,094.38
• EMA 20: $3,095.27
• EMA 50: $3,102.93
• EMA 200: $3,134.61
Reading: On the very short-term chart, price is slightly below the 20-EMA and clearly below the 50- and 200-EMAs. The regime flag here is bearish. That matches the hourly bias: short-term, the market is leaning lower.
For execution, that often means rallies into the 15-minute 50-EMA (currently around $3,100–3,105 and drifting) are treated as potential selling zones by intraday traders.
M15 RSI (14)
RSI 14 (M15): 46.59
Reading: Short-term RSI is just under 50, indicating slight selling pressure but overall balance. Bears are nudging price lower, but there is no severe downside momentum yet on this micro timeframe.
M15 MACD
• MACD line: -4.86
• Signal line: -5.24
• Histogram: +0.38
Reading: Both lines are negative, but the histogram has flipped slightly positive. That often shows a short-term attempt to stabilize or bounce inside a minor downtrend. In other words, the immediate selling wave is losing steam, but the larger intraday structure is still not convincingly bullish.
M15 Bollinger Bands
• Middle band: $3,092.67
• Upper band: $3,102.89
• Lower band: $3,082.45
• Price: $3,094.38
Reading: Price is near the middle of narrow bands on 15 minutes, which is very typical of a micro-consolidation. Short-term traders are effectively trading noise until a break of either $3,083 (lower band) or $3,103 (upper band) shows fresh initiative.
M15 ATR (14)
ATR 14 (M15): $6.38
Reading: Extremely tight price action on this timeframe: about a $6 average swing per 15 minutes. That is low-vol, range-trade territory and reinforces the idea that this is not yet a breakout phase.
M15 pivot levels
• Pivot point (PP): $3,093.80
• First resistance (R1): $3,094.96
• First support (S1): $3,093.23
• Price: $3,094.38
Reading: ETH is trading right on top of its 15-minute pivot and in an extremely tight micro-band between S1 and R1. This is pure intraday equilibrium. Any move of $5–10 can temporarily flip the micro-structure without altering the bigger picture at all.
Sentiment, macro crypto context, and DeFi backdrop
The broader crypto market cap is up modestly over the last 24 hours (about +0.65%), while volume is down sharply (around -13.7%). That combination often signals reluctant buying and low-conviction participation. BTC still dominates (near 57% dominance), which historically is a headwind for aggressive ETH outperformance.
The Fear & Greed Index at 27 (Fear) confirms that risk appetite is muted. In that kind of environment, markets tend to favor mean reversion and liquidity pockets over strong directional bets. It fits well with what we see on the ETH charts: a corrective base trying to form, but without the capital flows to drive a clean upside break yet.
On the DeFi side, Uniswap V3 fees have jumped over the last 7 days while 30-day metrics are still down, and other major DEXs show mixed but generally subdued fee profiles. That speaks to occasional spikes in activity but no sustained DeFi frenzy. For Ethereum, it means on-chain usage is not currently providing an overwhelming bullish narrative to counter the technical indecision.
Putting it together: scenarios for Ethereum ETH price
Bullish scenario for ETH/USDT
For the bullish case to take control, ETH needs to transition from a corrective bounce into a trend resumption. Technically, that looks like:
• On D1, price holds above the 20-day EMA (~$3,080) and starts to reclaim and close above the 50-day EMA (~$3,130).
• Daily MACD continues to expand positively and RSI pushes decisively above 55–60, showing momentum shifting from neutral to directional.
• On H1, ETH must flip the EMA stack, meaning sustained trading above $3,125–3,150, turning those moving averages into support instead of resistance.
• Bollinger Bands on H1 and D1 begin to open up with price walking the upper band, signaling a fresh upside volatility expansion.
If that happens, the near-term upside target becomes the $3,250–3,300 zone (daily upper band and a step toward the 200-day EMA). From there, the real battle is whether ETH can eventually attack the 200-day near $3,295–3,300 and turn the broader trend back up.
What invalidates the bullish scenario?
A daily close back below the 20-day EMA (roughly below $3,050–3,070) with RSI slipping back under 45 and the daily MACD rolling over would signal that this bounce has likely failed. A clean loss of the $3,000–3,020 region would sharpen that signal and reopen the door to a deeper correction.
Bearish scenario for ETH/USDT
For bears, the current environment is an opportunity if they can push the market from mild intraday weakness into a renewed daily downtrend.
Key elements for the bearish case:
• The hourly and 15-minute bearish regimes persist, with ETH consistently rejected at the $3,105–3,150 resistance cluster (H1 EMAs plus D1 pivot and R1).
• Price breaks and closes below $3,060–3,070 on the daily, pulling ETH under the pivot and the 20-day EMA and turning that area into resistance.
• Daily RSI drifts toward 40 and below, and MACD starts to flatten and cross down, signaling that the counter-trend buying phase is fading.
• On Bollinger Bands, ETH slides toward the mid-to-lower band area around $2,900–2,950, potentially setting up another test of the lower band envelope if selling accelerates.
In that scenario, a reasonable downside zone to watch would be $2,850–2,900, roughly aligning with the lower half of the current Bollinger structure and typical corrective extensions.
What invalidates the bearish scenario?
If ETH can reclaim and hold above $3,150 on an hourly closing basis, bringing H1 and M15 EMAs back underneath price, the bears lose their immediate edge. A confirmed daily close above the 50-day EMA with strengthening RSI and MACD would effectively invalidate the near-term bearish case and hand momentum back to buyers.
Neutral / range-bound base case
Given all the evidence, the base case right now is neutral with a slight bullish skew on the daily, against a short-term bearish bias on the intraday charts.
In practical terms, that often plays out as range trading between roughly $3,050 and $3,150 in the near term, with false breaks on either side until a higher timeframe catalyst, such as macro news, ETF flows, or protocol developments, arrives.
As long as ETH stays above $3,000 and below $3,250, the market is more likely to reward fade trades (selling strength near resistance, buying weakness near support) than aggressive breakout chasing.
Positioning, risk, and how to think about ETH here
This is a market where timeframe discipline matters more than usual. Daily traders see a potential base and a modest recovery, while hourly and 15-minute traders are still treating ETH as a sell-the-rally environment. Those conflicting signals are exactly what you expect in a transitional phase.
Volatility is moderate: the daily ATR near $95 means swings intraweek can easily be 3–5% without changing the bigger picture. Position sizing has to respect that noise level. A move from $3,100 to $3,000 or $3,200 looks big on an intraday chart, but structurally it is still just range behavior.
For anyone tracking Ethereum ETH price, the key is to be very clear about your timeframe and invalidation:
• If you are trading the bullish side, the market needs to start closing above $3,130–3,150 and hold the 20-day EMA as a floor.
• If you are leaning bearish, you want to see ETH lose the $3,050–3,070 band and fail on any retests from below.
The uncertainty is real: sentiment is in fear, BTC holds dominance, and DeFi activity is patchy. That backdrop does not prevent a move higher, but it does mean any trend that emerges will need to prove itself through sustained price action, not just a single spike.
If you want to monitor markets with professional charting tools and real-time data, you can open an account on Investing using our partner link:
Open your Investing.com account
This section contains a sponsored affiliate link. We may earn a commission at no additional cost to you.
Disclaimer: This analysis is for informational and educational purposes only and is not investment, trading, or financial advice. Markets are volatile and unpredictable; always do your own research and consider your risk tolerance and objectives before making any trading decisions.
In summary, ETH is consolidating in a controlled range with moderate volatility, a neutral-to-slightly-bullish daily structure, and short-term charts still leaning lower as traders wait for the next decisive move.


You May Also Like

DOT Technical Analysis Apr 25

Trump suddenly reverses course on Iran peace talks: 'Too much work!'


