

Chainlink price forms a bearish pennant as LINK ETF inflow fades
Chainlink price retreated for three consecutive days as demand for its exchange-traded funds faded and as buyers remained on the sidelines.
- Chainlink price has formed a bearish pennant pattern on the daily chart.
- This pattern points to more downside in the coming weeks.
- The demand for the Grayscale LINK ETF has waned in the past two days.
Chainlink (LINK) token dropped to $13, down by over 50% from its highest level in August last year. Its market capitalization has dropped to over $9.3 billion.
LINK token slumped as third-party data showed the demand for the Grayscale Chainlink ETF remained thin. The fund has not had any inflows in the last two days, bringing its cumulative net inflows to over $63.32 million. It has had just $4.1 million this month, much lower than last month’s $59.1 million.
The ongoing performance of the Grayscale LINK ETF means that the recently approved Bitwise fund will have a mild reception this year.
Chainlink’s funds have underperformed other popular altcoin ETFs, including XRP and Solana. XRP and Solana ETFs have had over $1.2 billion and $816 million in inflows since their launch.
Chainlink’s performance in the ETF market has been disappointing despite its strong fundamentals. For example, data compiled by CoinGlass indicate that the supply of LINK tokens on exchanges has declined to 122 million, down from the October high of 156 million.
Chainlink’s strategic reserve has continued growing since August. The supply has increased to 1.5 million, valued at over $19.8 million. Its last purchase happened this week when it acquired 87,829 LINK tokens currently worth over $1.1 million.
Chainlink has also increased its market share in the real-world asset tokenization industry, where it has launched partnerships with leading companies such as Swift, Euroclear, JPMorgan, and UBS.
Chainlink price technical analysis
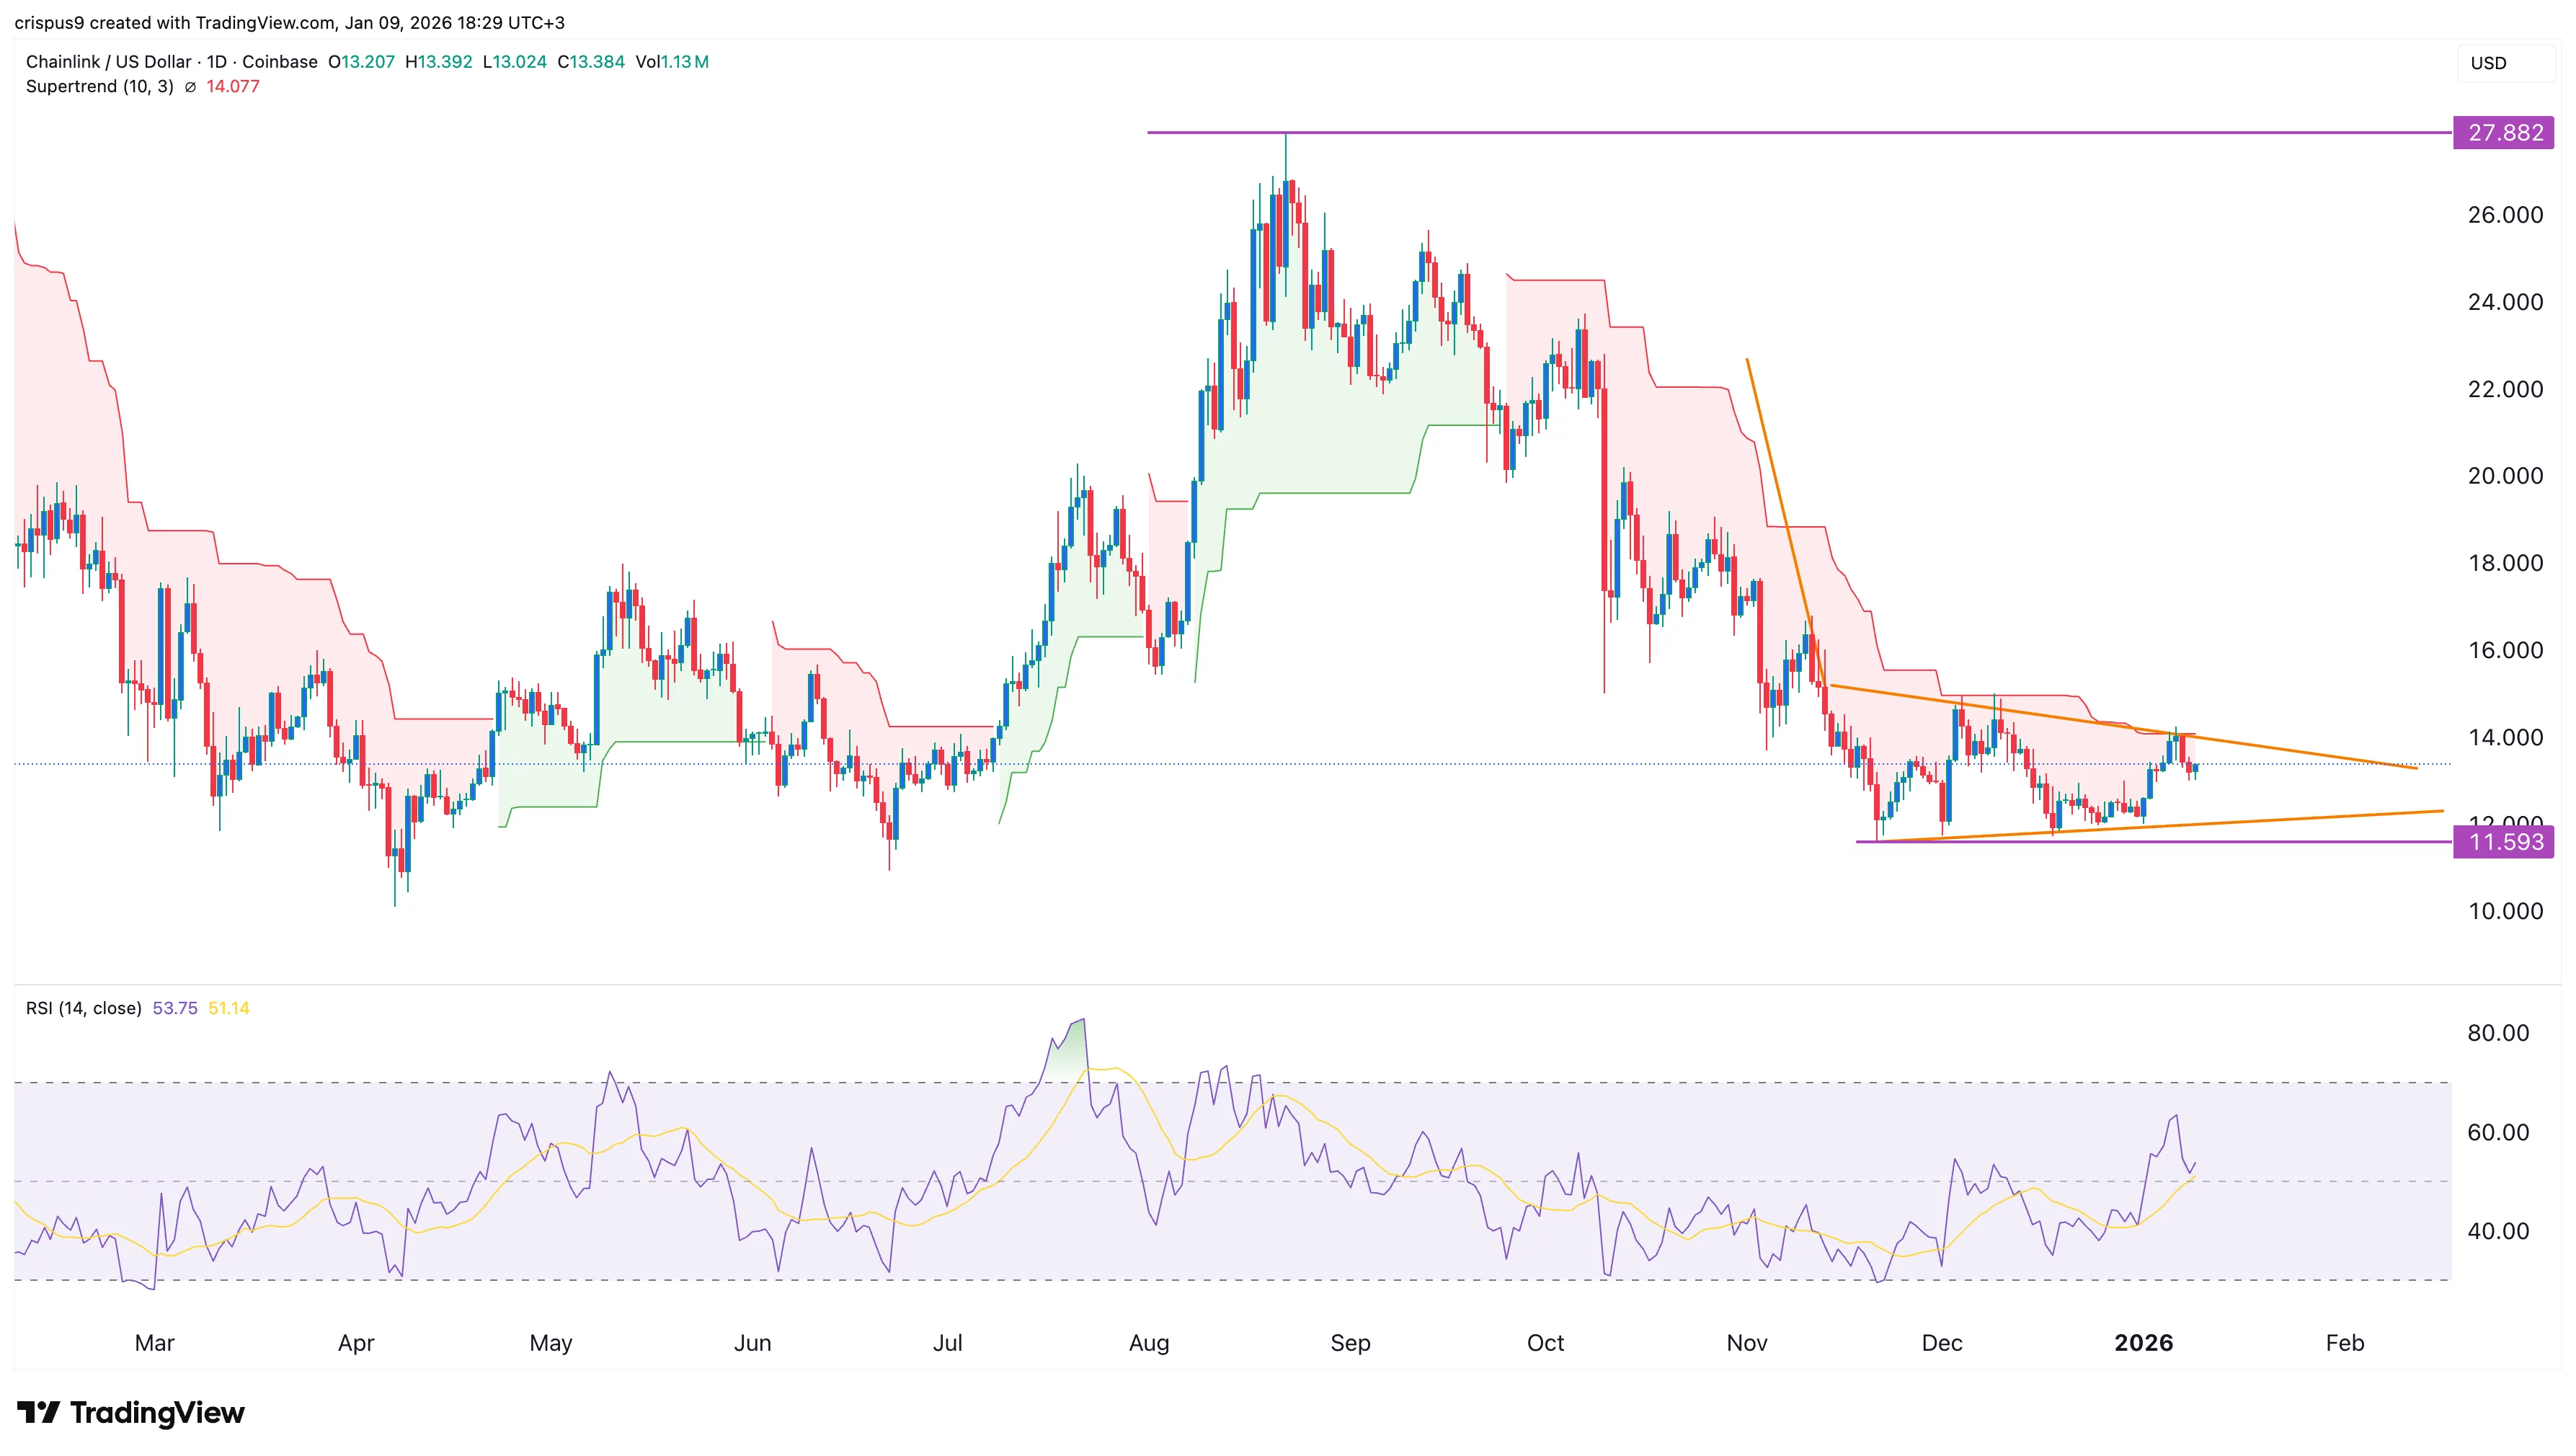
The daily timeframe chart shows that the LINK price has retreated from a high of $27.88 in August to the current $13.20.
A closer look shows that the token has formed a bearish pennant pattern, which is comprised of a vertical line and a symmetrical triangle. The two lines of this triangle are nearing their confluence.
Chainlink token has remained below the 50-day and 100-day Exponential Moving Averages. It has constantly remained below the Supertrend indicator. The Relative Strength Index has declined from 63 on January 6 to 52.
Therefore, there is a risk that the token will have a bearish breakout, potentially to the key support level at $11.60, its lowest level on Nov. 21.


You May Also Like

ZachXBT Releases ‘Circle Files,’ Alleges USDC Issuer Compliance Failures Across Multiple Crypto Hacks

What next as Ripple-linked XRP rises to $1.33 but fails to break out


