Market structure for Ethereum crypto (ETH/USDT) stays cautiously bullish above $3,100

While broader sentiment is still locked in fear, Ethereum crypto is quietly holding a constructive structure above key support and grinding higher on multiple timeframes.
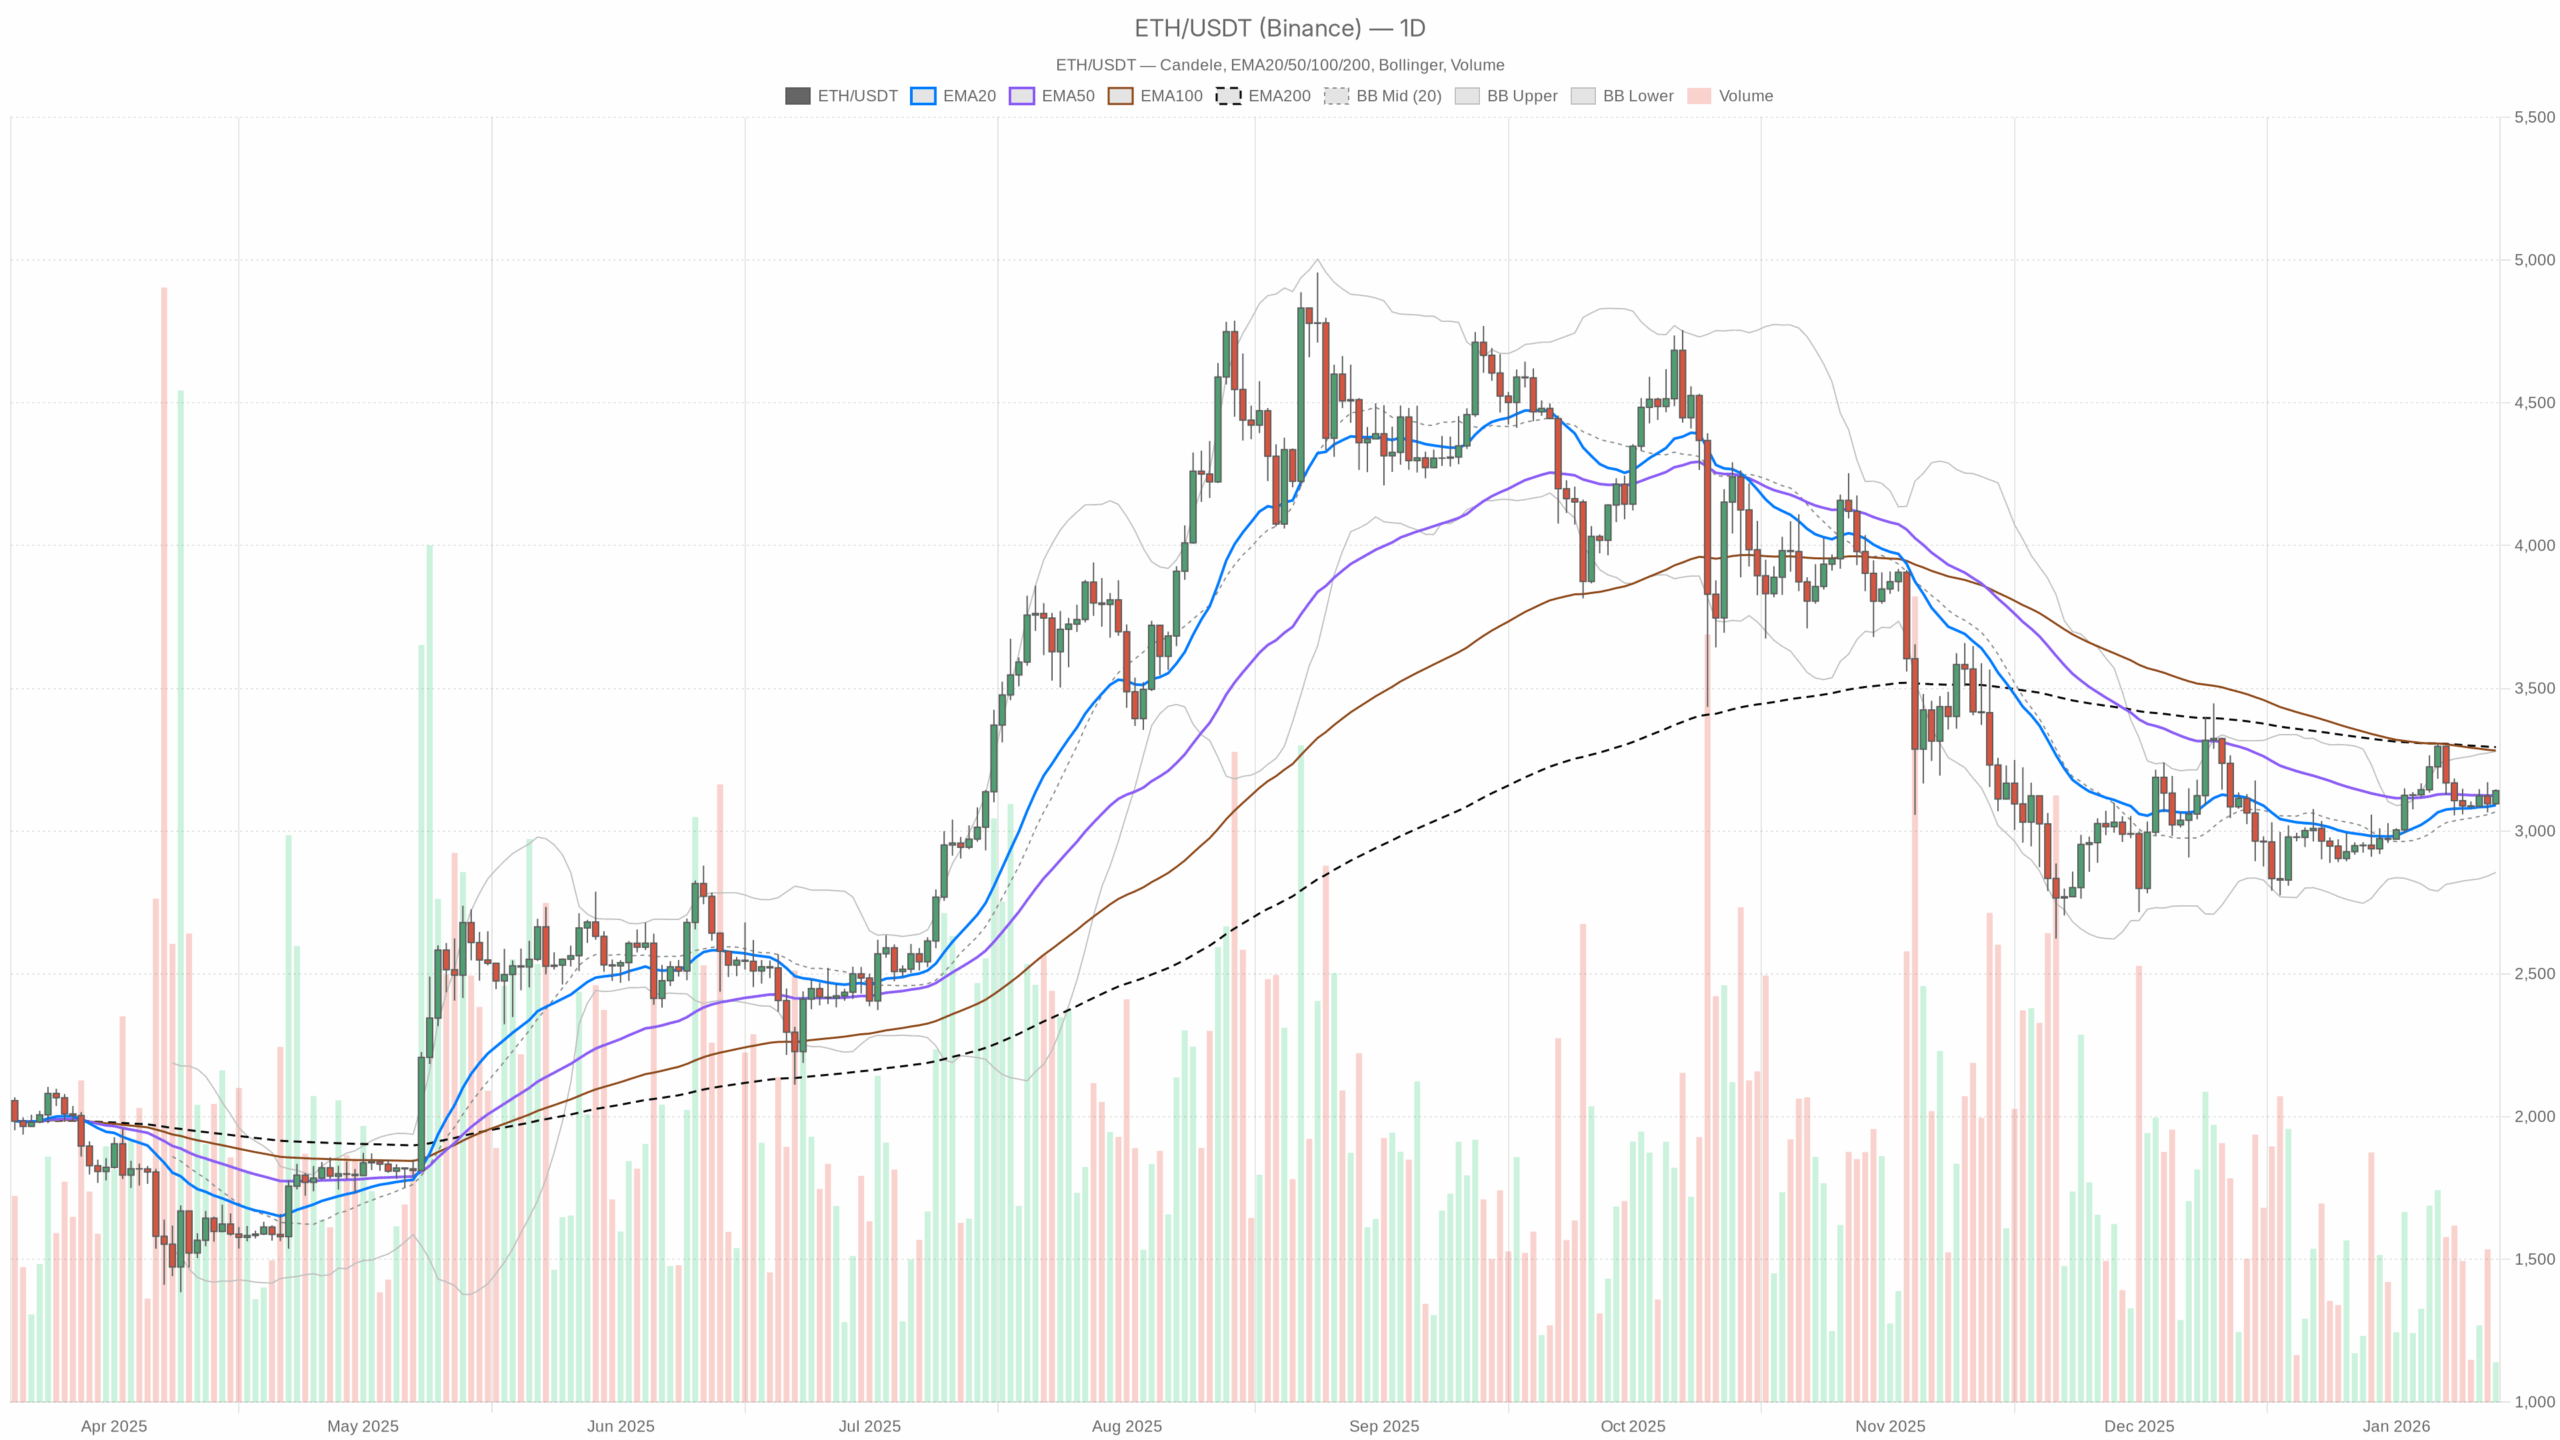 ETH/USDT — daily chart with candlesticks, EMA20/EMA50 and volume.
Daily chart (D1): main scenario – slightly bullish, but below the 200-day lid
On the daily, ETH/USDT is trading around $3,141.64. The model labels the regime as neutral, but the balance of evidence is tilting mildly bullish as long as price stays above $3,100.
EMAs (trend structure)
- Price: $3,141.64
- EMA 20: $3,090.71
- EMA 50: $3,125.24
- EMA 200: $3,294.12
ETH is trading above its 20- and 50-day EMAs, but below the 200-day. In plain terms, the short- and mid-term trend has turned up, while the longer-term trend is still capping price. This is classic early-recovery behavior after a larger corrective phase. Bulls have control in the last few weeks, but they are still fighting the overhead memory of sellers around $3,300 and above.
RSI (momentum)
- RSI 14: 54.85
RSI is slightly above the middle of the range, showing positive but not overheated momentum. Buyers have the edge, yet there is no sign of the kind of froth that usually precedes a sharp reversal. It fits a slow, grinding advance rather than a blow-off move.
MACD (trend-momentum confirmation)
- MACD line: 26.58
- Signal line: 22.44
- Histogram: 4.14 (positive)
The MACD line sitting above the signal with a positive histogram confirms that upside momentum on the daily is in play. The move is constructive but not explosive, so think of a steady upward bias rather than a vertical breakout. It backs the idea of a mild bullish environment on this timeframe.
Bollinger Bands & volatility context
- Middle band: $3,067.49
- Upper band: $3,279.58
- Lower band: $2,855.40
- Price: $3,141.64 (above mid-band, below upper band)
ETH is trading above the mid-band and comfortably below the upper band. That is typical of a controlled up-leg inside the bands, not a runaway squeeze. Moreover, as long as price holds above the mid-band (around $3,070), the path of least resistance on the daily stays to the upside, with the upper band around $3,280 acting as the next volatility-based target and potential supply zone.
ATR (daily volatility)
- ATR 14: $90.81
Daily ATR around $90 means roughly 3% intraday swings are normal right now. That is moderate volatility for ETH: enough to shake out tight stops, but not a panic regime. Position sizing needs to respect that a perfectly normal day can easily cover a $150–$180 intraday range.
Daily pivot levels
- Pivot point (PP): $3,126.72
- R1: $3,161.47
- S1: $3,106.88
Price is hovering slightly above the daily pivot and close to R1. That usually reflects a modestly bullish session tone: dips towards $3,125–$3,105 are likely to attract responsive buyers as long as the broader structure holds.
Daily takeaway: The main scenario on D1 is cautiously bullish. There is a higher probability of continuation towards $3,250–$3,300 than an immediate trend reversal, but the 200-day EMA at around $3,294 is a clear ceiling. Bulls are in control tactically, not strategically, yet.
1-hour chart (H1): intraday regime supports the bullish daily bias
The 1-hour timeframe is where the trend looks clearly bullish, and it is currently supporting the daily bias rather than fighting it.
EMAs (short-term trend)
- Price: $3,141.90
- EMA 20: $3,120.31
- EMA 50: $3,117.06
- EMA 200: $3,116.97
On H1, price is trading cleanly above all three EMAs, which are stacked bullishly (20 > 50 > 200). This is what a well-structured intraday uptrend looks like. Dips into the $3,120–$3,115 band are, for now, pullbacks within the trend rather than evidence of a top.
RSI (intraday momentum)
- RSI 14: 59.63
RSI just under 60 tells you buyers are in charge on the 1-hour, but the move is not extended. There is room for more upside before intraday momentum gets stretched.
MACD (trend follow-through)
- MACD line: 4.09
- Signal line: 0.05
- Histogram: 4.04 (strongly positive)
The MACD on H1 is clearly positive, consistent with a fresh or strengthening upswing. This aligns with the EMA structure and supports continuation rather than immediate mean reversion.
Bollinger Bands & local volatility
- Middle band: $3,115.01
- Upper band: $3,145.49
- Lower band: $3,084.53
- Price: $3,141.90 (near the upper band)
Price is hugging the upper band on the 1-hour. That is typical of a short-term uptrend with persistent buying. However, it also increases the odds of a pause or small consolidation rather than a straight-line extension.
ATR (H1 noise level)
- ATR 14: $16.71
On the hourly, an average swing of about $17 is the baseline. Intraday traders should expect $30–$40 round-trip moves without assuming the trend has changed, as that is just normal noise in this environment.
Hourly pivot map
- Pivot point (PP): $3,139.46
- R1: $3,145.82
- S1: $3,135.55
ETH is trading right above the hourly pivot and flirting with R1. That is an intraday bullish posture: pullbacks towards $3,135–$3,140 are likely to be bought first, as long as price holds above around $3,120.
H1 takeaway: The 1-hour chart is cleanly bullish and confirms the daily upward bias. There is no timeframe conflict here yet; both D1 and H1 are pointing to continuation, with H1 driving the move.
15-minute chart (M15): execution noise inside a bullish intraday leg
The 15-minute chart is only useful for execution context, and it is currently aligned with the bullish intraday story.
EMAs (micro-trend)
- Price: $3,140.88
- EMA 20: $3,127.39
- EMA 50: $3,120.19
- EMA 200: $3,115.16
Price is above all three EMAs, again bullishly stacked. Very short-term pullbacks into $3,125–$3,120 are, for now, just dips inside a working intraday uptrend.
RSI (short-term heat)
- RSI 14: 65.27
RSI in the mid-60s on M15 shows the move is starting to heat up at the micro level. It is not outright overbought, but definitely not cheap on this tiny timeframe. That usually favors a brief pause, sideways range, or shallow mean reversion before another attempt higher.
MACD (micro momentum)
- MACD line: 5.34
- Signal line: 5.19
- Histogram: 0.16 (barely positive)
The MACD line is fractionally above the signal, but the histogram is tiny. Momentum is still positive, but the surge phase may be cooling off. That fits with the elevated RSI: short-term energy is there, but it is no longer accelerating hard.
Bollinger Bands & micro-volatility
- Middle band: $3,129.24
- Upper band: $3,142.45
- Lower band: $3,116.04
- Price: $3,140.88 (pressing the upper band)
ETH is essentially riding the upper band on M15. That is a micro uptrend, but also a place where late chasers often get faded. From a trading perspective, this argues for patience rather than buying right at the band, unless you are explicitly playing a momentum breakout.
ATR (M15 noise)
- ATR 14: $7.24
Very short-term swings of $7–$10 on a 15-minute candle are normal. Anyone operating on this timeframe needs generous breathing room for stops or tighter, very tactical entries around support and resistance.
15-minute pivot levels
- Pivot point (PP): $3,139.12
- R1: $3,145.14
- S1: $3,134.87
Price is just above the M15 pivot and beneath R1. The micro structure is bullish but extended; pullbacks towards $3,135–$3,140 are the first reasonable reaction zones in this very short horizon.
Market backdrop for Ethereum crypto: bullish structure in a fearful market
Broad crypto market cap is around $3.23T, up about 1.48% in 24h, with BTC dominance near 57% and ETH share around 11.7%. The important part is that the fear & greed index sits at 26 (Fear) while ETH is trading with a constructive multi-timeframe setup.
That mismatch, with fearful sentiment but stable-to-bullish structure, typically favors patient accumulation and mean-reverting dips rather than chasing euphoric spikes. It also means any sharp pullback can be violent, because positioning is still cautious and leverage pockets can get flushed quickly.
Scenarios for ETH/USDT
Bullish scenario (favored as long as $3,070–3,100 holds)
In the bullish path, the current grind higher on H1 and M15 continues, with dips being bought above the daily mid-Bollinger band and short-term EMAs. ETH holds above $3,100, and ideally above the daily pivot at around $3,126. Momentum on D1 remains positive, with the MACD histogram staying green and RSI holding above 50, and the intraday EMAs on H1 continue to act as a rising floor.
In that case, Ethereum crypto has room to probe the $3,250–3,300 zone, where the daily upper Bollinger band (around $3,280) and the 200-day EMA at about $3,294 sit. This is the critical battleground. A clean break and acceptance above the 200-day EMA would shift the longer-term narrative back toward a more decisive bull phase rather than a mere bounce.
What invalidates the bullish scenario?
A sustained break below the $3,070–3,100 band would be the first serious warning. Concretely:
- Daily closes below the mid-Bollinger band (around $3,067).
- RSI dropping back under 50 and MACD rolling over toward a bearish cross on D1.
- H1 structure flipping, with price losing the EMA 200 on H1 (around $3,117) and failing to reclaim it.
If those unfold, the current controlled uptrend morphs back into a larger-range consolidation with downside risk toward $3,000 or even the lower daily band region.
Bearish scenario (less likely for now, but structurally possible under the 200-day)
The bearish play is essentially a failure at resistance. ETH could stall or fake-break near $3,200–3,280, rejecting from the confluence of the daily upper band and the still-declining 200-day EMA. If intraday momentum fades, with RSI diverging and MACD on H1 crossing down while price is still under the 200-day, sellers can regain control.
From there, you would look for a move back below the daily pivot at around $3,126, then through S1 around $3,107, with daily RSI slipping towards 45 and the daily MACD histogram turning negative. Under that pressure, a revisit of the $3,000–2,950 region and possibly the lower half of the daily Bollinger range (around $2,850–2,950) comes back on the table.
What invalidates the bearish scenario?
A clear, sustained push above the 200-day EMA (around $3,294) with daily closes holding above it would blunt the bearish case. If that happens while daily RSI pushes into the low 60s and the MACD expands to the upside, the argument that this is just a rally into resistance breaks down. Bears would then be forced into a short-covering mode, often fueling a secondary leg higher.
Positioning, risk, and uncertainty
Structurally, Ethereum crypto is in a constructive but incomplete recovery. Short- and mid-term trends are bullish, while the long-term picture is still neutral to slightly heavy under the 200-day. The broader market is fearful, yet ETH is behaving more like a risk-on asset than the sentiment numbers imply.
For traders, the key battlegrounds are clear:
- Support zone: $3,070–3,100 (daily mid-band, recent consolidation floor).
- Resistance zone: $3,250–3,300 (daily upper band and 200-day EMA cluster).
Volatility is moderate but significant. An average daily range near $90 means intraday swings can wipe out poorly placed stops. Shorter timeframes are aligned to the upside, but also somewhat extended, which often precedes shallow pullbacks inside the trend.
The market right now rewards disciplined reaction to levels more than aggressive prediction. As long as ETH holds above its key daily support band, the bias stays with the bulls. If that band is lost, the tape shifts back to a broader range with meaningful downside air pockets.
If you want to monitor markets with professional charting tools and real-time data, you can open an account on Investing using our partner link:
Open your Investing.com account
This section contains a sponsored affiliate link. We may earn a commission at no additional cost to you.
Disclaimer: This analysis is for informational and educational purposes only and is not investment, trading, or financial advice. Cryptocurrency markets are highly volatile and can result in significant losses. Always do your own research and consider your risk tolerance before making any trading decisions.


You May Also Like
Ripple XRP Deep Dive: Is This Payments Token Still a Smart Long-Term Investment?

The Next Crypto Breakout Below $1 Investors Are Preparing For