

Disclaimer: this material is not financial advice or a call to action. The analysis presented is the author’s personal opinion. Incrypted is not responsible for readers’ investment decisions.
Disclaimer: this material is not financial advice or a call to action. The analysis presented is the author’s personal opinion. Incrypted is not responsible forDisclaimer: this material is not financial advice or a call to action. The analysis presented is the author’s personal opinion. Incrypted is not responsible for
Geopolitics And the Risk of a Potential Sell-off — a Trader Shared a Forecast for Bitcoin and Ethereum
For feedback or concerns regarding this content, please contact us at crypto.news@mexc.com
Bitcoin has finally moved off dead center: scenario C played out, the price broke above $95,000, and then — as expected — reacted off $98,000, followed by a pullback after the weekend. The backdrop, as usual, added chaos: a statement by U.S. President Donald Trump was published on January 17, 2025 (when the market reacts sluggishly), plus the tariff court story suddenly got rescheduled, while geopolitics and political noise around the Fed only add to the jitters.
At the same time, this is important: the market reacted rather positively to the inflation data, which means risk appetite has not broken yet — but the structure still needs confirmation.
The key Bitcoin question this week is simple: is this a healthy correction after the impulse, or the start of a deeper unwind? Below are the base scenarios, no guesswork.
Scenario A — topping up liquidity above → pullback into lower magnets
The logic here is that the market finishes filling the upper FVG/shelf, after which it delivers a correction toward last week’s lows or lower — to the next liquidity pool.
What matters most here is the reaction inside the imbalance: often this is a weekly open manipulation, and the speed of the return will show who is in control of price.
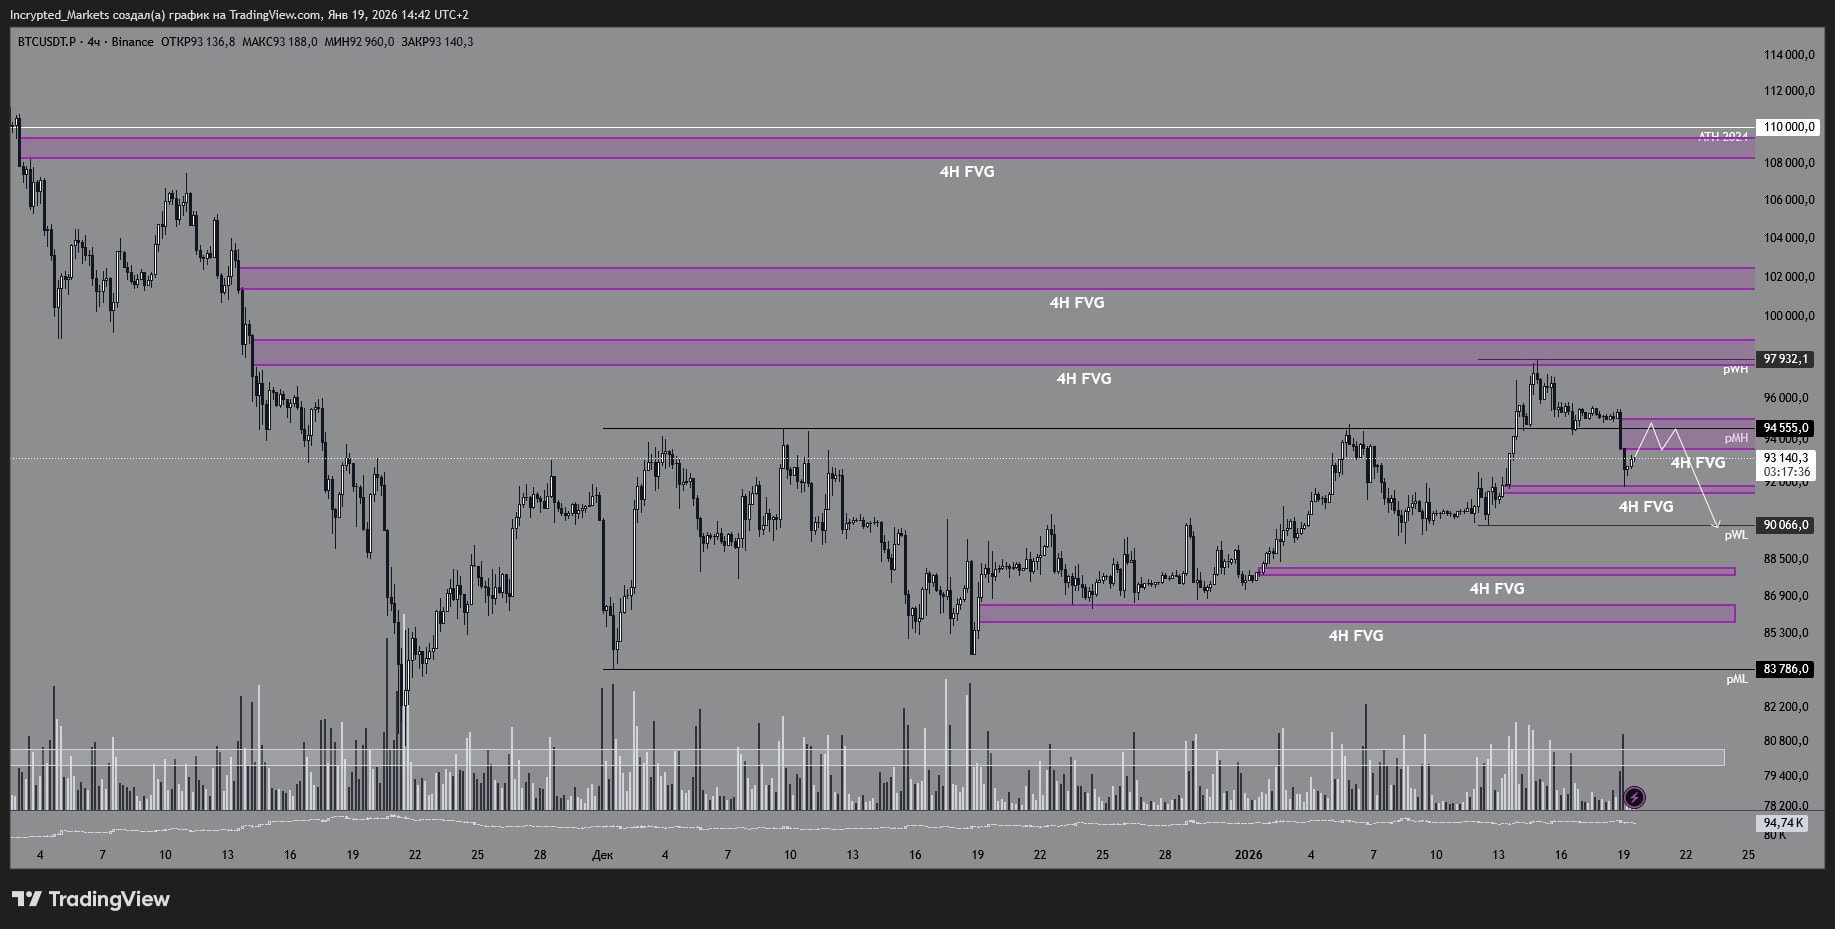 BTC/USDT.P four-hour chart. Source: TradingView.
Scenario B — swept above, accepted price → recovery
If, after the shakeout, the market digests the distribution (longs have already been partially flushed, hence the liquidations), the next logical target is to take out short stops, as shorts will be forced to chase the move.
The entry logic here is through working with the FVG: either Equilibrium (0.5), or a Full Fill with a clear reaction and acceptance.
 Four-hour BTC/USDT.P chart. Source: TradingView.
Scenario C — Correction Continues (Risk-Off Driven by Headlines)
The U.S. session is opening — it could add momentum and, via a fake-up, push price into a continuation of the pullback. Triggers: macro windows plus Trump’s speeches and headlines.
We’re not watching the news, but how DXY and yields react — that’s the fastest way to see the market regime.
 Four-hour BTC/USDT.P chart. Source: TradingView.
Ethereum played out the same scenario block, and even more cleanly: there was a solid push into the $3,500 zone, we fell just short — but that actually leaves room if the market flips back to risk-on. Right now, as with bitcoin, we’re in a pause/compression: the asset is waiting to see where the leader takes liquidity.
Scenario A — Fill the FVG From Above → Pull Back to $3,100-$3,061 and Test $3,000
If we sweep liquidity in the imbalance, the next logical magnet is $3,100, then last week’s lows at $3,061, and the psychological $3,000. That’s where it will become clear: whether the base holds, or the “floor under our feet” starts sliding away.
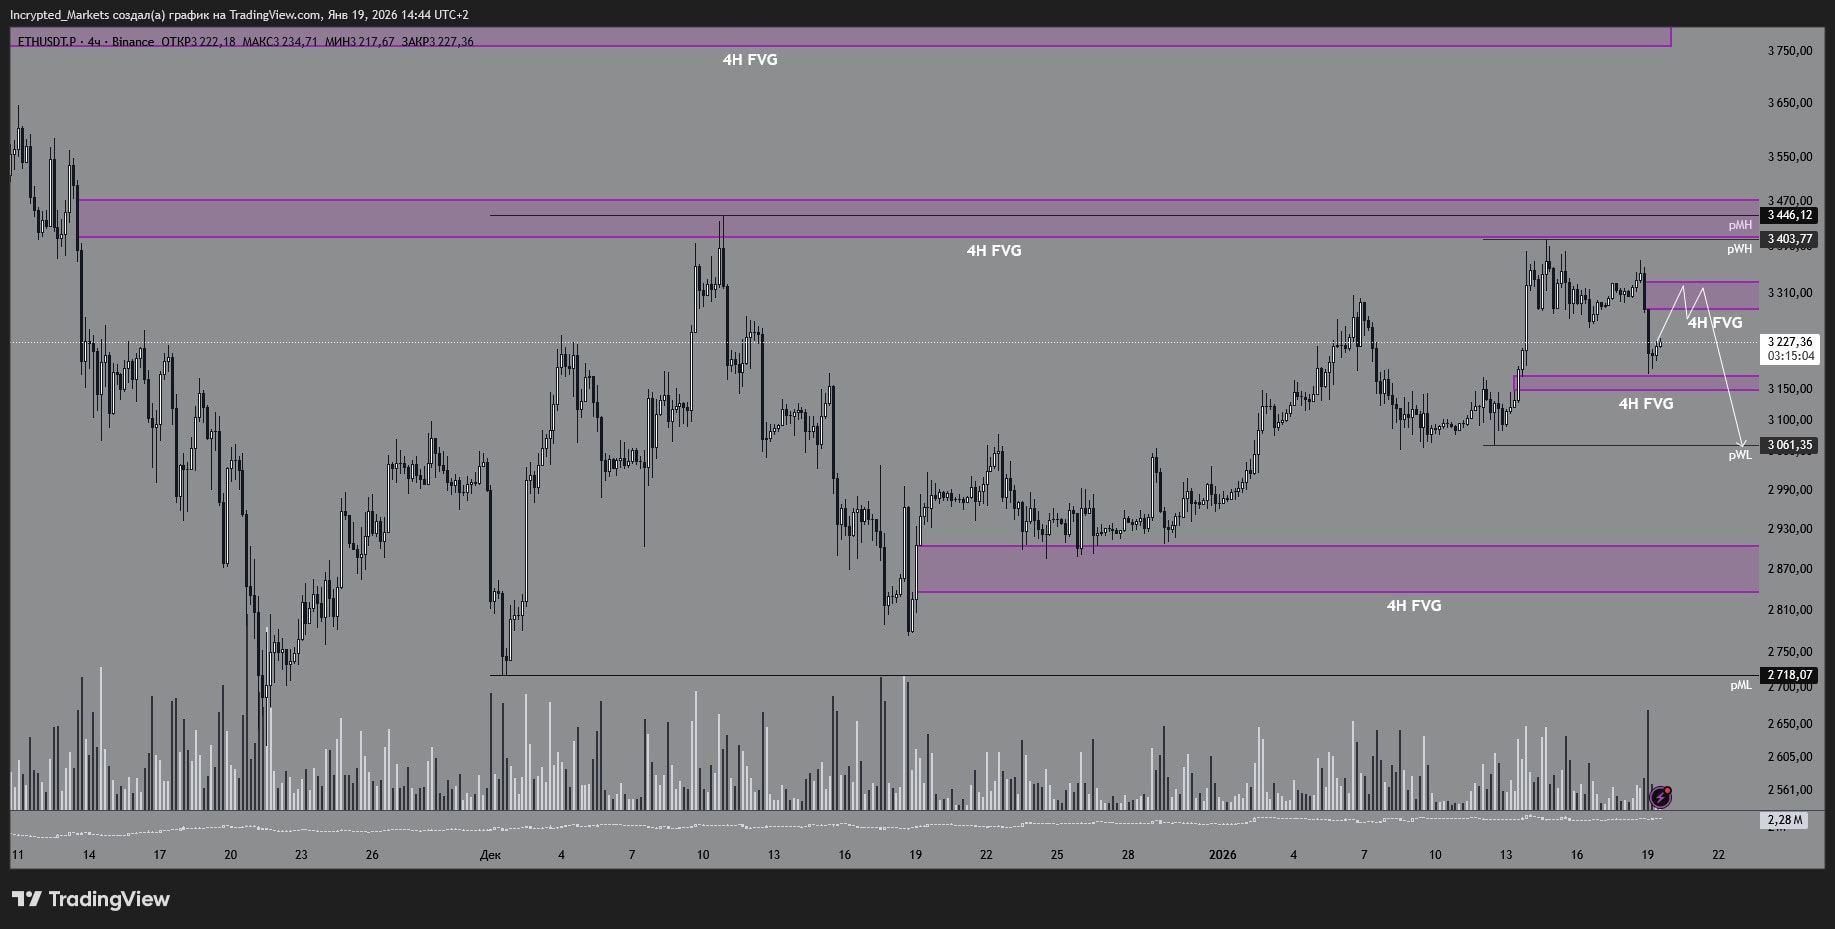 Four-hour ETH/USDT.P chart. Source: TradingView.
Scenario B — Sweep Above → Reaction and an Attempt to Continue Higher
The option we’d like to see: sweep the pool, get a bid, and move into a recovery. What matters here is that the move holds, not just a single candle.
 Four-hour ETH/USDT.P chart. Source: TradingView.
Scenario C — correction continues on headlines/macro
Either via a top-up from above, or straight from current levels — a pullback to sweep lower liquidity. Timing-wise, this lines up well with Trump’s speeches and broader geopolitical risk.
 Four-hour ETH/USDT.P chart. Source: TradingView.
The week could be volatile, but that still doesn’t mean the market is back. The fact is simple: upper liquidity has been swept, fear has been shaken out, moves have been made — now it’s more important to understand which model the market chooses next.
The playbook remains unchanged: reaction → return → confirmation.
One or two clean executions are better than chasing candles in the noise.
Bitcoin remains the main driver, and for Ethereum we’re watching for synchronization and zones to scale in. I’ll post updates as they come if the structure starts to become readable.
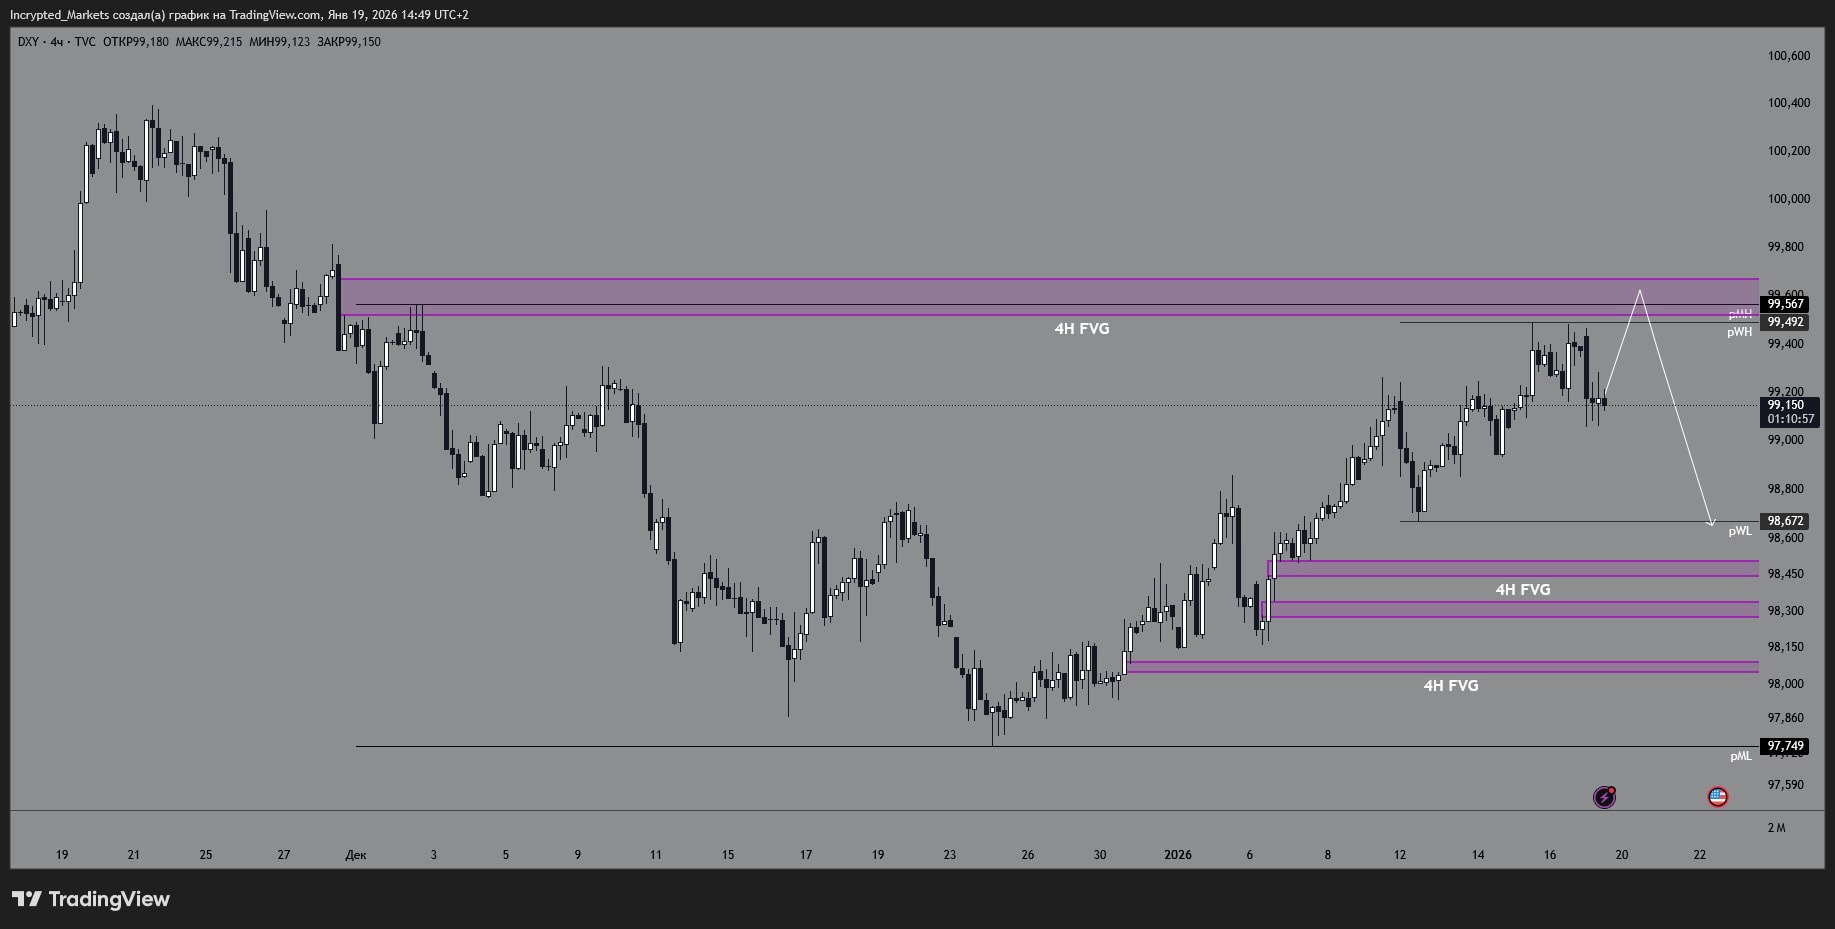
The dollar index has captured a local impulse and ran into the upper supply zone: pWH ~99.492 + the upper 4H FVG up to ~99.567.
Below, there are still “magnets” for liquidity collection: pWL ~98.672, and lower — pML ~97.749 + the lower 4H FVGs.
In a week like this, DXY can act as a regime switch: if price is accepted above resistance, high-risk assets usually struggle; if it fails to accept and starts selling off, crypto gets some breathing room.
Key zones
- resistance: 99.49–99.57 (pWH + 4H FVG) → above that, the next reference is 100.00–100.40
- supports: 98.67 (pWL) → 98.30–98.45 (4H FVG) → below ~98.0–98.15 (4H FVG) → 97.75 (pML)
Below are the DXY scenarios for the week.
Scenario A — no acceptance above → flush to refill liquidity (risk-on gets easier)
If the 99.49–99.57 zone fails to hold, the logical move is a pullback to pWL 98.67. From there, we watch the reaction: hold → we can chop/stabilize, lose it → the path opens into the lower 4H FVG.
 DXY index chart. Source: TradingView.
Scenario B — a downside sweep and a return to the upside
A classic “dirty” week: a quick dip below 98.67, stop-hunting, and a reclaim with acceptance back above 99.00, followed by a retest of 99.49–99.57. This often produces a cleaner structure than a straight breakout.
 DXY index chart. Source: TradingView.
Scenario C — acceptance above 99.49–99.57 → continuation higher (risk-off hits harder)
If we see acceptance and holding above the 4H FVG, then the target is 100.00+ and potentially 100.40. For crypto, this is usually a “brake” until yields start cooling off in parallel.
 DXY index chart. Source: TradingView.
How to read this through the lens of the crypto market:
- DXY up + US2Y/US10Y up → more often pressure on risk, BTC/alts have a tougher time;
- DXY down → risk breathes easier, but look for confirmation after: reaction → return → acceptance at the levels.
Key events of the week
- Monday, 19.01 — Martin Luther King Jr. Day (US) → thin liquidity, more wicks, less trend;
- Wednesday, January 21 — 15:30 | Trump speech → headline driver. Read the reaction through DXY + yields, not the first tweet
- Thursday, January 22 — 15:30 | GDP (q/q) + Jobless Claims
- Thursday, January 22 — 17:00 | Core PCE (key event of the week)
- Thursday, January 22 — 19:00 | crude oil inventories (inflation expectations)
- Friday, January 23 — 16:45 | PMI (services + manufacturing) → the economy’s “pulse,” can either extend Thursday’s momentum or fade it.
Tactics: don’t chase the first candle. This week, how the market accepts levels matters more than the headlines themselves. Trade the confirmation around 99.49–99.57 and 98.67: reaction → pullback → hold.
Market Opportunity
Notcoin Price(NOT)
$0.0005577
$0.0005577$0.0005577
USD
Notcoin (NOT) Live Price Chart


Disclaimer: The articles reposted on this site are sourced from public platforms and are provided for informational purposes only. They do not necessarily reflect the views of MEXC. All rights remain with the original authors. If you believe any content infringes on third-party rights, please contact crypto.news@mexc.com for removal. MEXC makes no guarantees regarding the accuracy, completeness, or timeliness of the content and is not responsible for any actions taken based on the information provided. The content does not constitute financial, legal, or other professional advice, nor should it be considered a recommendation or endorsement by MEXC.
You May Also Like

XRP To $10? Thesis Links CLARITY Act To Bank-Scale Liquidity
The post XRP To $10? Thesis Links CLARITY Act To Bank-Scale Liquidity appeared on BitcoinEthereumNews.com. Jake Simmons, a dedicated crypto journalist, has been
Share
BitcoinEthereumNews2026/05/12 20:07

MSTR Stock Keeps Falling as MSTY’s Huge Yield Sparks a New Debate
TLDR MSTR stock remains under pressure as Bitcoin continues trading in a tight range. Strategy faces added risk because its share count keeps rising through continued
Share
Blockonomi2026/04/03 01:56

Nigeria invests $9m in research to drive digital economy ambitions
Nigeria has committed $9 million (₦12 billion) to a new national research initiative aimed at strengthening evidence-based policymaking
Share
Techcabal2026/04/02 18:17


