XRP ETFs Post Record Outflows as Ripple Extends Price Slide
XRP price faces heightened downside risks following massive outflows from US Spot XRP exchange-traded funds (ETFs) amid risk-off sentiment in the broader crypto market.
Rising US and Japan bond yields signal macroeconomic stress, dragging the total crypto market capitalization 32% below its October 2025 peak.
BTC, ETH, and XRP retested their lowest levels in more than two weeks after crypto and stock markets digested US President Donald Trump’s fresh round of tariff threats.
The potential tariffs are an attempt by the administration to convince Denmark to reconsider its control of Greenland.
The S&P 500 index fell 1.9%, while gold prices surged to a new all-time high of around $4,885/ounce, and the crypto market capitalization dropped to $3 trillion, down from nearly $3.2 trillion, according to Coingecko data.
XRP dropped nearly 1% in the last 24 hours to trade at $1.90 as of 4:39 a.m. EST, with an intraday low of around $1.89.
Spot XRP ETFs Records $53.32 Million in Net Outflows
According to Coinglass data, spot XRP ETFs recorded $53.32 million in net outflows on Tuesday, January 20, marking their second-ever daily capital outflow and the largest since they began trading in November 2025.
The outflow was from Grayscale’s GXRP ETF, which recorded a total outflow of $55.39 million. Meanwhile, Franklin’s XRPZ recorded $2.07 million in inflows.
Following the latest outflow, total net inflows since launch now stand at $1.22 billion.
The recent bearish spell was not unique to XRP, as most other crypto ETFs also saw outflows. Specifically, the BTC ETFs recorded $479.70 million in outflows, while the ETH ETFs recorded $230 million.
Can XRP Stabilize or Is More Downside Ahead?
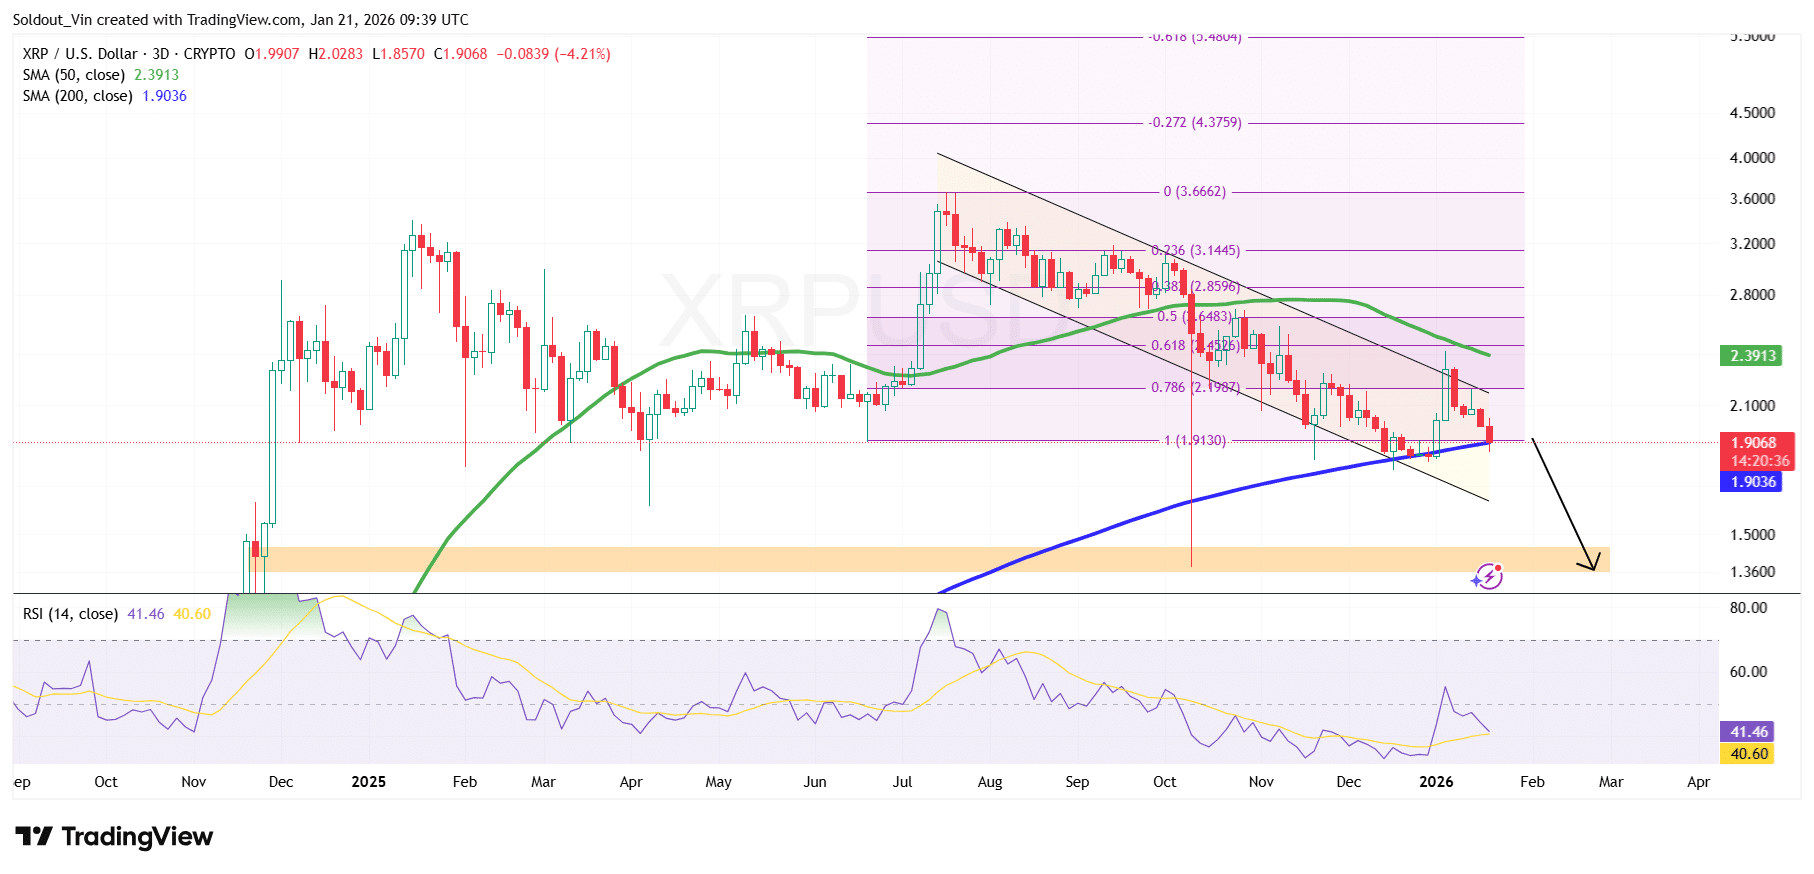
XRP price is currently trading around $1.90–$2.00, sitting directly on top of the 200-day Simple Moving Average (SMA) near $1.90, which has become a critical long-term support level. The price remains well below the 50-day SMA at $2.39, highlighting persistent medium-term bearish pressure.
After peaking near the $3.60–$3.70 region, XRP entered a prolonged corrective phase, forming a falling channel pattern.
Despite this, XRP has so far managed to defend the $1.85–$1.90 zone, an area that also aligns with a major Fibonacci extension level from the prior advance.
The 50-day SMA remains downward-sloping, signaling that trend momentum has not yet shifted in favor of the bulls. As long as the price of XRP trades below this SMA.
Overhead, the $2.20–$2.40 region stands out as a heavy resistance band, combining the descending channel top and the 50-day SMA.
XRP’s Relative Strength Index (RSI) is currently hovering around 41, below the neutral 50 level. This suggests weak momentum, though RSI is not yet deeply oversold.
 XRP/USD Chart Analysis Source: TradingView
The higher-timeframe XRP/USD chart suggests the Ripple token may attempt a short-term stabilization above the $1.85–$1.90 support zone, given the confluence with the 200-day SMA. A sustained hold here could allow for another corrective move toward $2.10–$2.30, where prior breakdown levels and channel resistance converge.
A decisive daily or multi-day close above the $2.30–$2.40 region would be required to weaken the bearish structure.
On the downside, a clean break below the 200-day SMA and $1.85 support would significantly change the bearish structure. As a result, XRP could slide toward the $ 1.35–$ 1.50 demand zone.
Related News:


You May Also Like

Sui’s Beep Wallet Unleashes AI Power: Agentic Trading Expands to 300+ Assets

Most Expensive NFT: Record-Breaking Digital Art Sales