

XRPUSDT presses range lows as Ripple crypto today trades under extreme fear
In a risk-off environment and fearful sentiment, Ripple crypto today is trading heavy against USDT near the bottom of its recent range.
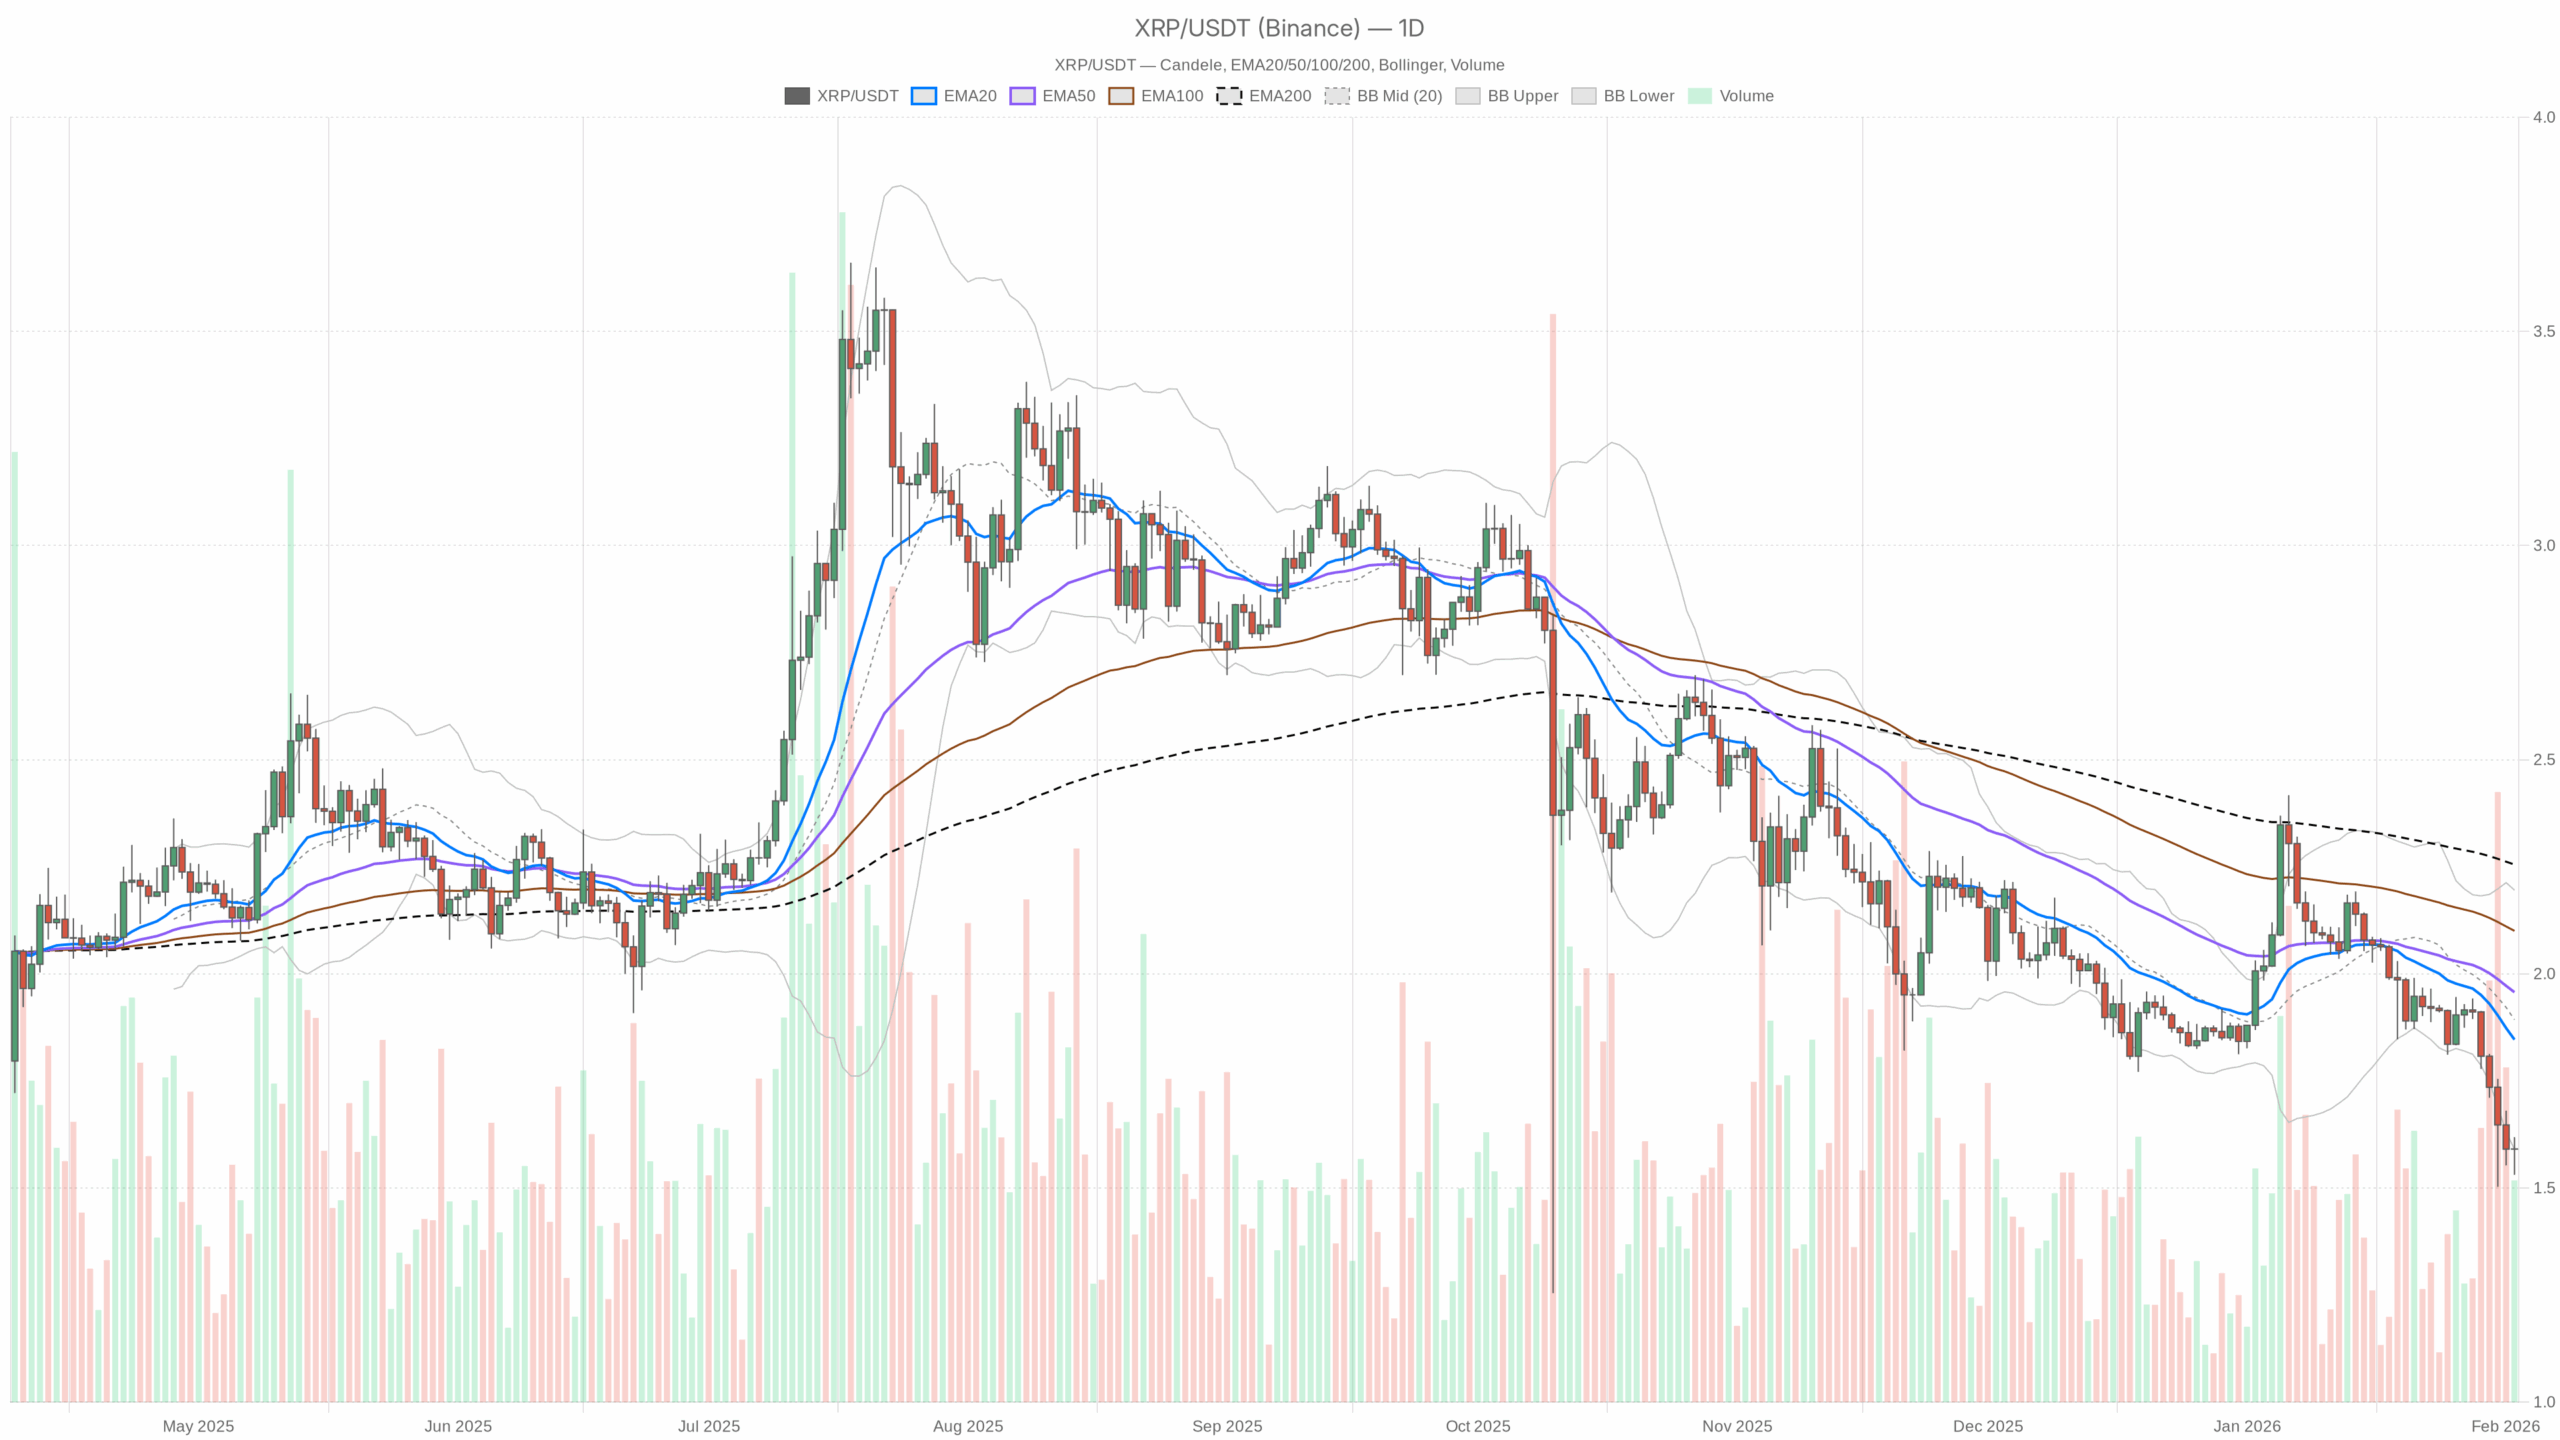 XRP/USDT daily chart with EMA20, EMA50 and volume”
loading=”lazy” />XRP/USDT — daily chart with candlesticks, EMA20/EMA50 and volume.
Daily timeframe (D1): macro bias – clearly bearish, but stretched
On the daily chart, the regime is marked as bearish, and the price action justifies it.
Trend structure: EMAs
– Price: 1.59
– EMA 20: 1.85
– EMA 50: 1.96
– EMA 200: 2.26
All three key EMAs sit well above current price, with a clean bearish stack (20 < 50 < 200) and XRP trading ~0.26 below the 20-day EMA. This is classic downtrend structure: rallies into the 20–50 day zone are likely to be treated as selling opportunities until proven otherwise.
What it implies: Trend followers are in control. Any bounce from here is, by default, a counter-trend move unless XRP can reclaim and hold above the 20-day EMA around 1.85.
Momentum: RSI
– RSI 14 (D1): 26.21
Daily RSI is deeply oversold, sitting around 26. That tells us the recent selloff has been intense and possibly overextended in the short term.
What it implies: The selling wave is mature. We are entering the zone where sharp short-covering and mean-reversion bounces become more probable, but oversold can stay oversold in strong downtrends, so this is a warning of exhaustion, not an automatic buy signal.
Momentum trend: MACD
– MACD line: -0.10
– Signal line: -0.06
– Histogram: -0.04
The MACD line is below the signal line and both are below zero, with a negative histogram. Momentum is firmly on the downside and has not yet shown a clear bullish crossover.
What it implies: The broader momentum backdrop still favors the bears. Even if we get a bounce, MACD says the primary daily impulse is still down and trend reversals typically require more time and base-building.
Volatility and bands: Bollinger Bands & ATR
– Bollinger mid: 1.89
– Upper band: 2.20
– Lower band: 1.59
– ATR 14 (D1): 0.10
XRP is right on the lower Bollinger Band at 1.59. Daily ATR around 0.10 means a typical daily swing is about 6–7% at these price levels.
What it implies: Price being glued to the lower band shows the downtrend has been persistent, but also that we are now at an area where two scenarios often play out: either a band-walk continuation (grinding lower along the band) or a snapback toward the mid-band around 1.89. With ATR moderate, there is room for a 0.10–0.20 relief move without changing the larger bearish structure.
Short-term reference points: daily pivot
– Pivot point (PP): 1.58
– Resistance 1 (R1): 1.63
– Support 1 (S1): 1.54
Price at 1.59 is sitting almost exactly on the daily pivot (1.58), with immediate resistance at 1.63 and first support at 1.54.
What it implies: We are hovering at a short-term equilibrium level inside a broader downtrend. 1.54–1.58 is the first key demand zone intraday; lose that decisively, and the market will likely look for new lows. A push through 1.63 would be the first sign that buyers are trying to wrestle back some control for a bounce.
Hourly timeframe (H1): bearish bias, but selling pressure is cooling
The hourly regime is still labeled bearish, but the tone is softer than on the daily chart.
Trend structure: EMAs (H1)
– Price: 1.59
– EMA 20: 1.60
– EMA 50: 1.63
– EMA 200: 1.76
On H1, price is sitting just under the 20-hour EMA and comfortably below the 50 and 200. The bearish stack is still intact, but the distance to the fast EMA is very small now.
What it implies: The intraday downtrend is intact, but we are no longer in a waterfall. The market is starting to consolidate just below short-term moving averages, which often precedes either a relief pop into the EMA cluster (mean reversion) or a fresh push lower if sellers re-engage.
Momentum: RSI (H1)
– RSI 14 (H1): 44.19
Hourly RSI is in the low-to-mid 40s – not oversold, not overbought, slightly below neutral.
What it implies: Intraday selling pressure has normalized. The market is not panicking here; it is more of a wait-and-see consolidation after the daily flush. There is room in either direction without immediate momentum extremes on this timeframe.
Momentum trend: MACD (H1)
– MACD line: -0.02
– Signal line: -0.02
– Histogram: 0.00
On the hourly, MACD lines are basically flat and overlapping near the zero region with a near-zero histogram.
What it implies: The strong intraday downside impulse has stalled. We are in a pause phase where the next significant move (bounce or breakdown) has not been decided yet. This sits in tension with the firmly bearish daily MACD – the big picture is still down, but the shorter timeframe is catching its breath.
Volatility and bands: Bollinger Bands & ATR (H1)
– Bollinger mid: 1.59
– Upper band: 1.62
– Lower band: 1.56
– ATR 14 (H1): 0.04
Price is almost exactly at the mid-band on H1, with very tight bands and hourly ATR at 0.04.
What it implies: Volatility has compressed intraday. This kind of squeeze after a trend move often precedes a directional expansion. Given the daily downtrend, the burden of proof is on the bulls: they need to push toward 1.62–1.63 to escape another leg lower.
Intraday levels: hourly pivot
– Pivot (H1): 1.59
– R1: 1.59
– S1: 1.59
The hourly pivot set is effectively flat at 1.59, mirroring the current price.
What it implies: Very short-term order flow is finely balanced right now. The next hourly push away from 1.59 – whether into 1.62 or down to 1.56 – will likely set the tone for the rest of the session.
15-minute timeframe (M15): neutral, micro consolidation at the lows
The 15-minute regime is labeled neutral, which fits with the picture of short-term indecision at the bottom of a broader downtrend.
Trend structure: EMAs (M15)
– Price: 1.59
– EMA 20: 1.58
– EMA 50: 1.59
– EMA 200: 1.63
On M15, price is slightly above the 20-period EMA and roughly in line with the 50, with the 200 above.
What it implies: On the execution timeframe, XRP has managed to stabilize and even lean slightly above the fastest moving average, but it is still far from breaking the broader intraday downtrend defined by the 200 EMA at 1.63. This is typical basing or flag behavior after a drop.
Momentum: RSI & MACD (M15)
– RSI 14 (M15): 53.53
– MACD line: 0.00
– Signal line: 0.00
– Histogram: 0.00
RSI on M15 is slightly above 50, and MACD is essentially flat at zero.
What it implies: Very short-term momentum is balanced with a minor bullish tilt. Sellers are no longer in control on this micro timeframe, but buyers have not yet shown strength beyond a basic stabilization. This supports the idea of a potential short-term bounce setup inside a dominant daily downtrend.
Volatility and bands: Bollinger Bands & ATR (M15)
– Bollinger mid: 1.58
– Upper band: 1.61
– Lower band: 1.54
– ATR 14 (M15): 0.02
Price is sitting close to the mid-band with 15-minute ATR at 0.02, which is small relative to the daily range.
What it implies: The market is coiling on the lower timeframes. Short bursts of 0.02–0.04 moves can unfold quickly, but they are still noise relative to the daily structure. For active traders, this is the zone for fine-tuning entries and stops rather than redefining the big picture.
How the timeframes fit together
– Daily (D1): clear bearish trend, oversold momentum, price pinned to the lower Bollinger Band – the macro bias is bearish but stretched.
– Hourly (H1): still bearish but showing signs of exhaustion; momentum has cooled, and volatility has compressed around 1.59.
– 15m (M15): neutral to slightly constructive; micro-timeframe is trying to base at the lows.
There is an explicit tension here: trend and structure are bearish, but momentum and volatility are hinting at a potential short-term mean-reversion bounce. In other words, the main scenario is still bearish on Ripple crypto today, but the reward-to-risk of chasing fresh shorts at 1.59 is less attractive than it was earlier in the move.
Dominant scenario for Ripple crypto today: bearish with bounce risk
Given the daily trend and the market-wide environment (BTC dominance high, total market cap down, extreme fear), the primary scenario for XRPUSDT remains bearish. However, because we are oversold on D1 and stabilizing on intraday charts, the next move may be a bear market bounce rather than immediate continuation.
Bullish scenario for XRPUSDT
A constructive path for the bulls from here would look like this:
1. Defense of 1.54–1.58 support: Buyers step in above or around the daily S1 at 1.54, preventing a clean breakdown. Repeated tests that keep wicking below 1.58 but closing back above would show demand absorbing supply.
2. Break above 1.63 intraday resistance: Clearing both the daily R1 and the H1 upper band region around 1.62–1.63 would indicate that the immediate selling pressure has been neutralized.
3. Mean reversion toward 1.75–1.89: With oversold daily RSI, a relief rally back toward the 20-day EMA at 1.85 and the Bollinger mid-band at 1.89 becomes plausible. On the way, the zone 1.70–1.75 would be an important test of whether the bounce has real participation or is just a short squeeze.
What validates the bullish scenario:
– Strong hourly closes above 1.63 followed by sustained trading above the 20-day EMA near 1.85.
– Daily RSI pushing back above 35–40, signaling that the worst of the downside momentum has passed.
– MACD on H1 turning decisively positive and starting to drag the daily histogram toward zero.
What invalidates it:
– A clean daily close below 1.54 (D1 S1) with expanding ATR and price walking the lower Bollinger Band downward.
– Intraday rallies failing repeatedly at 1.63, showing that every bounce is being sold aggressively.
Bearish scenario for XRPUSDT (main bias)
The more likely path in the current context is that XRP remains in a downtrend, with any bounce capped below key resistance zones.
1. Failure to reclaim 1.63–1.70: Price chops around 1.58–1.62, maybe spikes to 1.65–1.70, but cannot sustain above the cluster of intraday EMAs and resistance. This keeps the structure of lower highs intact.
2. Break of 1.54 and band-walk lower: Once 1.54 gives way on a closing basis, XRP starts hugging or extending below the lower daily Bollinger Band, pulling ATR higher as volatility re-expands.
3. Continuation leg down: In that case, daily RSI could stay oversold for longer, and XRP would move into price discovery lower, with traders watching psychological round numbers and prior swing lows from earlier months as the next possible supports.
What validates the bearish scenario:
– Rejection of price around 1.63–1.70 with rising volume on down candles.
– Continuation of the bearish EMA stack on D1 with price staying comfortably below the 20-day EMA at 1.85.
– Daily MACD remaining negative and failing to curl upward despite oversold RSI.
What would seriously weaken it:
– A decisive reclaim and hold above the 20-day EMA around 1.85, turning that level into support rather than resistance.
– Daily closes back inside the Bollinger Bands with price gravitating toward the mid-band near 1.89 rather than hugging the lower band.
Positioning, risk, and uncertainty
For traders looking at XRPUSDT, the message is straightforward: trend is down, sentiment is fearful, and we are sitting at the lower edge of the range. That combination is usually hostile to late shorts but still unsupportive for aggressive longs without confirmation.
Volatility (as measured by ATR) is not extreme, but it is high enough that a single day can easily wipe out a tight-risk intraday position. Oversold conditions often produce sharp counter-moves that punish poor entries on both sides.
In this kind of tape:
– Chasing breakouts or breakdowns without a clear plan around 1.54–1.63 can be dangerous – this band is where the battle is happening.
– Multi-timeframe alignment matters: the daily chart still calls the shots, and it is bearish. Any intraday bullish setup is, by definition, a counter-trend play until XRP can reclaim the 20-day EMA and stop hugging the lower band.
The next meaningful clue for XRPUSDT will come from whether price expands away from the current 1.59 equilibrium with increasing volume and ATR. Until then, the default assumption is that we are in a bearish trend with short-term bounce risk rather than a confirmed bottom.
If you want to monitor markets with professional charting tools and real-time data, you can open an account on Investing using our partner link:
Open your Investing.com account
This section contains a sponsored affiliate link. We may earn a commission at no additional cost to you.
Disclaimer: This analysis is for informational and educational purposes only. It reflects a technical reading of market data at a specific point in time and is not a recommendation to buy, sell, or hold any asset. Crypto markets are highly volatile and involve substantial risk; always make your own decisions and consider your risk tolerance and time horizon.
You May Also Like

The Channel Factories We’ve Been Waiting For

Ethereum Price Prediction: ETH Targets $10,000 In 2026 But Layer Brett Could Reach $1 From $0.0058
