

Ethereum Activity Surges Even as ETH Price Sells Off
Ethereum is showing a rare and striking divergence. While ETH has been under heavy selling pressure, dropping from the $3,000 area into the $1,800–$2,000 range, on-chain activity has moved in the opposite direction, reaching levels never seen before.
According to a report shared by CryptoQuant, Ethereum’s network usage has surged even as price weakened sharply.
What the Chart Shows
The chart tracks Ethereum active addresses, including a 7-day simple moving average. That average climbed aggressively during the sell-off and reached a new all-time high of roughly 825,000 active addresses on February 3.
This reading exceeds activity levels recorded during both the 2018 cycle peak and the 2021 bull market, marking the highest sustained participation in Ethereum’s history.
How to Read This Divergence
A sharp rise in active addresses during a price decline typically reflects stress in the system. One interpretation is capitulation, where dormant coins move, transactions spike, and retail participation increases as weaker holders rush to exit.
At the same time, the data also supports a second interpretation. Unlike past bear phases, when on-chain activity usually contracted, Ethereum’s network is currently processing record levels of interaction despite the drawdown. That suggests the chain’s utility and usage remain structurally strong even as price reprices lower.
Why This Matters Now
The combination of record network activity and a roughly 40% price correction places Ethereum in a zone of elevated tension. Historically, periods where activity expands near price lows have often coincided with ownership shifting from panic-driven sellers to longer-term holders.
From a structural perspective, the $1,800 area stands out as a key level to monitor, as it sits beneath a network that is more active than ever.
Structural Takeaway
Based strictly on the chart and CryptoQuant data, Ethereum is experiencing extreme volatility, not disengagement. Price has fallen sharply, but network participation has reached an all-time high. Whether this activity reflects final capitulation or deeper adoption will become clearer with time, but the divergence itself is one of the most notable on-chain signals in Ethereum’s history.
The post Ethereum Activity Surges Even as ETH Price Sells Off appeared first on ETHNews.


You May Also Like
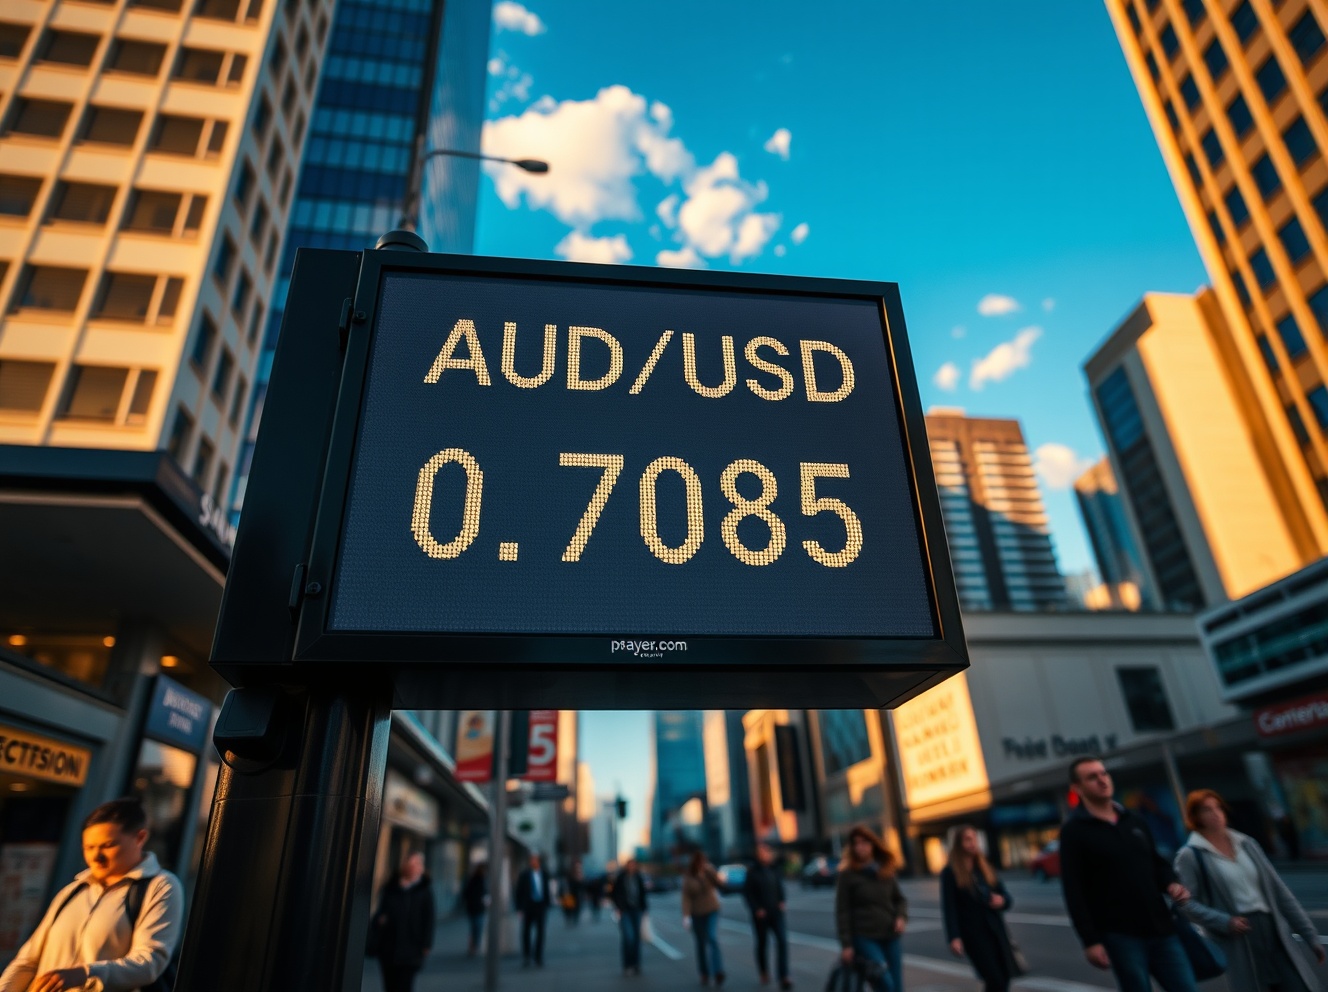
Australian Dollar Dips Below 0.7100 as Middle East Tensions Weigh on Risk Sentiment

Fed Governor Calls For Strong Stablecoin Oversight As CLARITY Act’s Final Text Gets Delayed


