

Bitcoin’s Sunday Plunge Creates Largest CME Gap in Weeks: What’s Next?
TL;DR
- Bitcoin futures opened with a massive CME gap, sparking debate on the potential for quick fills near $116,700.
- Whale dumped 24,000 BTC worth $2.7B, triggering $4,000 price drop and a liquidation cascade.
- Analysts highlight a $111,900 support zone, with deeper levels near $103K if selling pressure continues.
CME Gap Formation
Bitcoin futures opened with a wide gap on the CME chart, one of the largest in recent weeks. The range stretches from approximately $113,800 to $116,700, following the substantial crash that occurred on Sunday evening. At press time, Bitcoin was at around $111,400, sitting well below the gap zone.
Daan Crypto Trades, who has tracked gap behavior over time, explained that these occurrences often close quickly once trading resumes.
For now, traders are watching whether momentum is strong enough to bring the price back into the gap for a test.
Seasonal Trends and Market Conditions
Merlijn The Trader pointed to historical performance during September and wrote,
The comment suggests that volatility and drawbacks may persist into September before a potential recovery in October.
Bitcoin’s price has declined nearly 3% in the last 24 hours and by the same percentage weekly. Spot trading volumes remain high as markets adjust to short-term resistance and support tests.
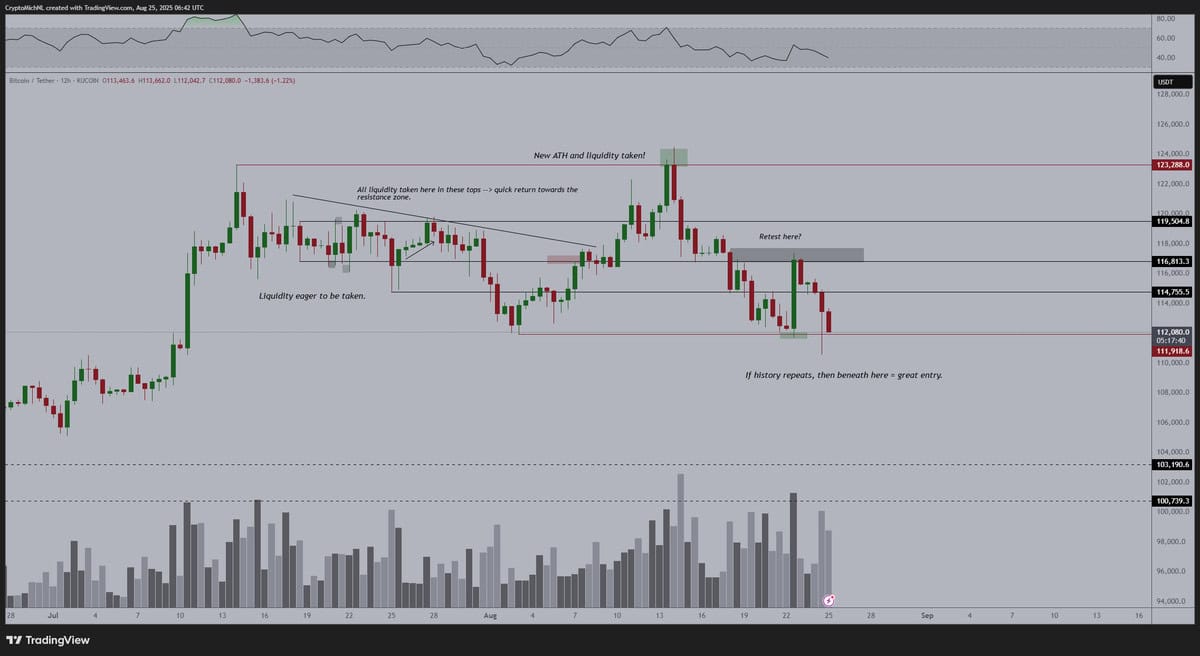
In addition, Michaël van de Poppe noted that recent price action is similar to earlier liquidity sweeps.
His chart marks $111,900 as a key level where stops may be cleared before a rebound. Resistance zones sit at $114,800, $116,800, and $119,500. Deeper support is located near $103,190 and $100,800. Trading volume has risen during recent declines, suggesting liquidity is being taken before a potential shift higher.
 Source: X
Whale Activity and Liquidations
Analyst ZYN linked the recent volatility to a whale transaction. They reported that 24,000 BTC, worth about $2.7 billion, was sold across several exchanges. The move triggered a $4,000 drop within minutes and caused a wave of liquidations. Despite the sale, the wallet still holds more than 152,000 BTC.
The sharp move suggests that large holders continue to play a key role in short-term price swings.
The post Bitcoin’s Sunday Plunge Creates Largest CME Gap in Weeks: What’s Next? appeared first on CryptoPotato.


You May Also Like

Securitize Integrates with TRON Network to Expand Tokenized Asset Offerings

Securitize Expands Tokenized Assets to TRON Network


