

Pi Network (PI) Surges 40% Weekly, Bitcoin (BTC) Fights for $68K: Market Watch
Bitcoin’s rather underwhelming price movements around $68,000 continue as the asset slipped below that level on a couple of occasions in the past 24 hours.
WLFI has soared the most from the larger-cap alts in the past 24 hours, while significantly more modest gains from ETH have pushed the asset to just over $2,000.
BTC Fragile at $68K
The first trading week of the current month resulted in a massive calamity for bitcoin, as the asset plunged to $60,000 for the first time since October 2024. This crash represented a $30,000 decline in the span of just over a week.
The bulls finally intervened at this point and helped BTC recover $12,000 in just a day. However, it faced immediate selling pressure at $72,000 and spent the following several days trading between that upper boundary and the lower one at $68,000.
It lost the support a week ago, but quickly reclaimed it and rocketed to over $70,000 during the weekend. However, that was another fakeout and returned to under $70,000 a day later. It slipped below $67,000 yesterday after the latest rejection, but now stands above $68,000, which is essentially the same level as this time yesterday.
Its market cap has remained calm at $1.365 trillion on CG, while its dominance over the alts is down to 56.2%.
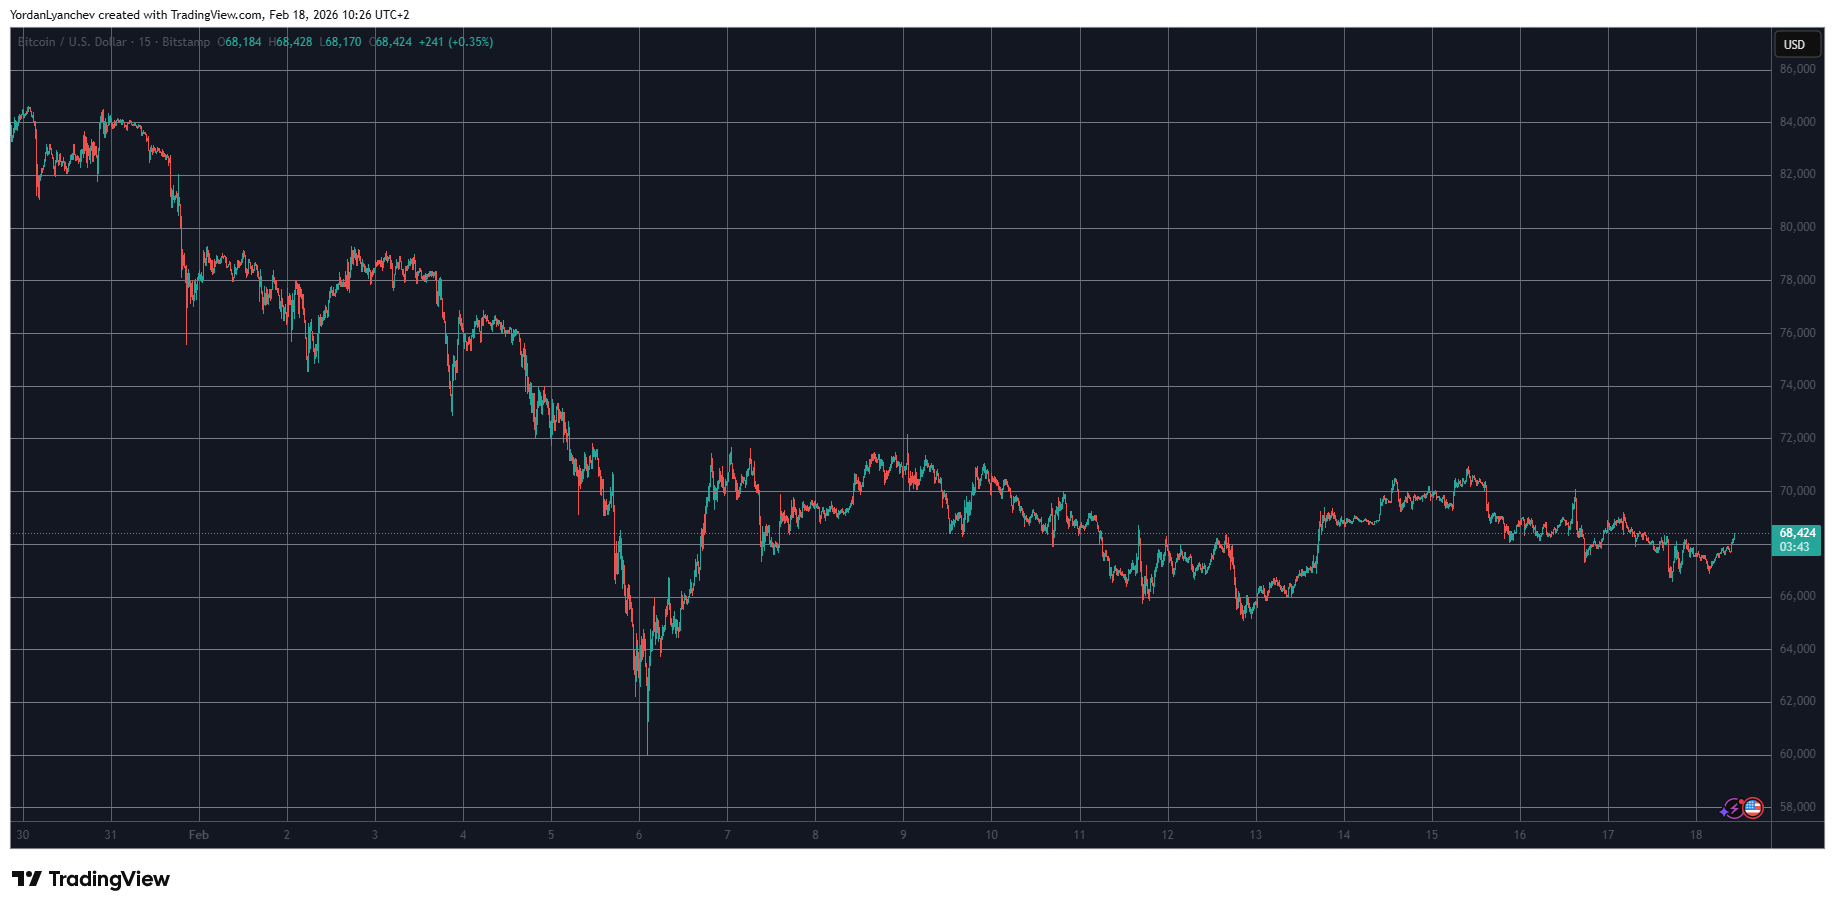 BTCUSD Feb 18. Source: TradingView
PI’s Weekly Surge
Ethereum is up by 2% in the past day and now sits above $2,000 once more. XRP has neared $1.50 after a minor increase. BNB, DOGE, BCH, and CC are also slightly in the green, while TRX and HYPE are with minor losses. WLFI has stolen the show in the past 24 hours, surging by over 17% to over $0.115.
On a weekly scale, though, Pi Network’s PI token shines. The asset is up by over 40% within this timeframe, as it dumped to a new all-time low of $0.1312 at the time. It now sits close to $0.19 after another 6% daily increase.
The total crypto market cap has added over $25 billion in a day and is up to $2.430 trillion on CG.
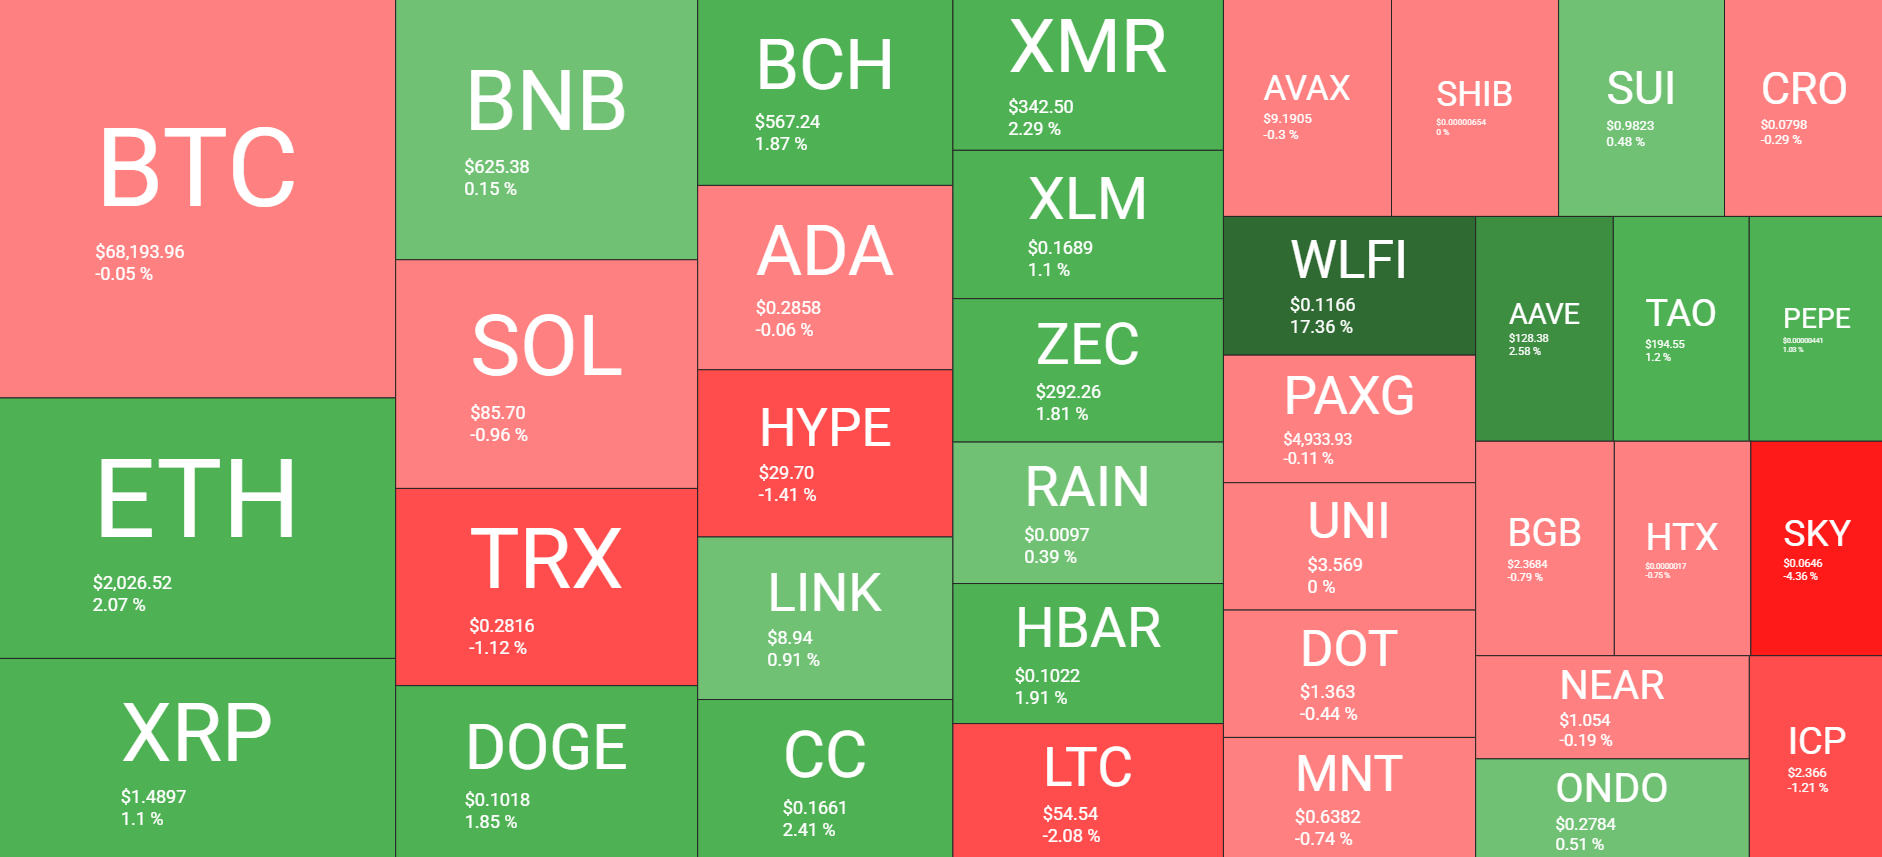 Cryptocurrency Market Overview Feb 18. Source: QuantifyCrypto
The post Pi Network (PI) Surges 40% Weekly, Bitcoin (BTC) Fights for $68K: Market Watch appeared first on CryptoPotato.
You May Also Like

Crucial US Stock Market Update: What Wednesday’s Mixed Close Reveals

TRX Price Prediction: Testing $0.32-$0.35 Resistance Zone as Technical Momentum Builds

Pi Network DEX Launch Confirmed for March 12, 2026: A New Chapter for Picoin and Web3 Trading
Pi Network has officially confirmed the launch date of its decentralized exchange (DEX), scheduled for Marc