Bitcoin price at risk of hitting $50k, Coinbase premium sinks
Bitcoin price remained in a tight range this week, and the waning Coinbase Premium Index points to more downside as institutional demand wanes.
- Bitcoin price has formed a bearish pennant pattern on the daily chart.
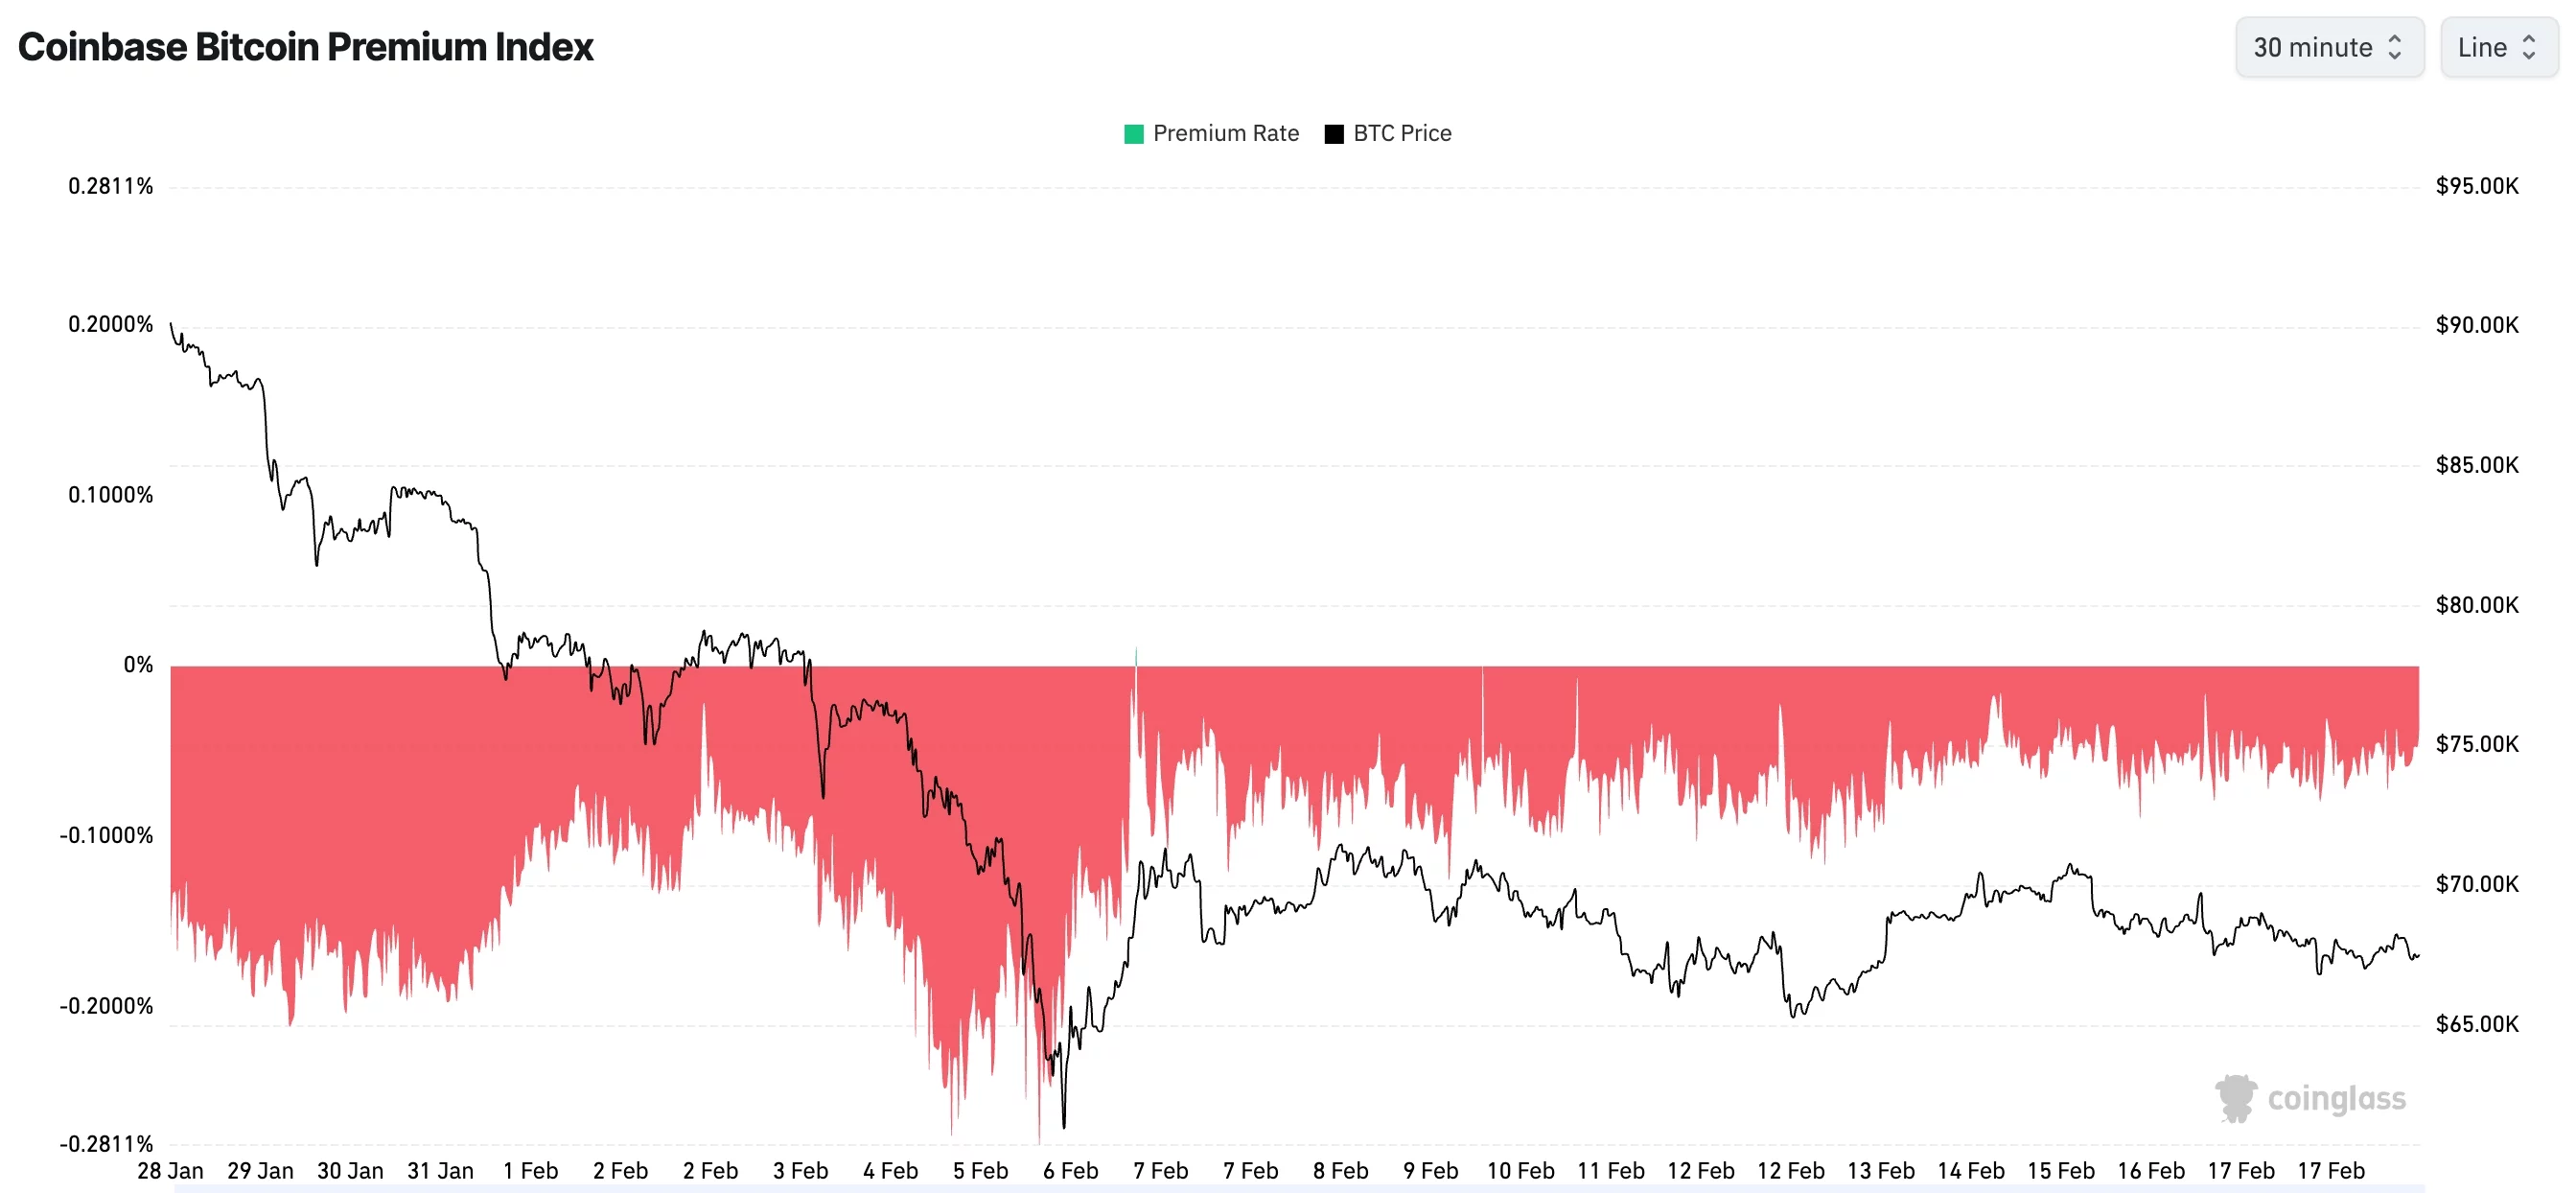
- The Coinbase Premium Index has remained in the red, a sign of weak demand from the US.
- Futures open interest has continued falling this month.
Bitcoin (BTC) was trading at $67,420 on Wednesday, down modestly from last weekend’s high of over $70,000. It has slumped by double digits from its all-time high of $126,300.
One major risk facing Bitcoin is that institutional demand has largely waned in the United States, which explains why the Coinbase Premium Index has remained in the red throughout this year. Coinbase is the most preferred platform for Bitcoin investing by American investors.
Additionally, only a handful of Bitcoin treasury companies are accumulating Bitcoin as they did last year. Strategy continued buying Bitcoin last week, bringing its total holdings to over 717,000. American Bitcoin and Strive have also bought Bitcoin this year.
Meanwhile, SoSoValue’s data shows that spot Bitcoin ETF outflows have jumped in the past few months. All these funds have shed over $8 billion in assets since October last year, and the trend is continuing.
According to Bloomberg, institutions have largely given up on Bitcoin because it has not fulfilled its role as a hedge against inflation and equity market stress. It has also not served its perceived role as a hedge against currency debasement.
Bitcoin’s futures open interest has continued falling in the past few months and now sits at $44 billion, down sharply from last year’s high of over $95 billion. Also, demand for borrowed exposure on CME has remained muted into the past few months.
Bitcoin price technical analysis suggests a crash
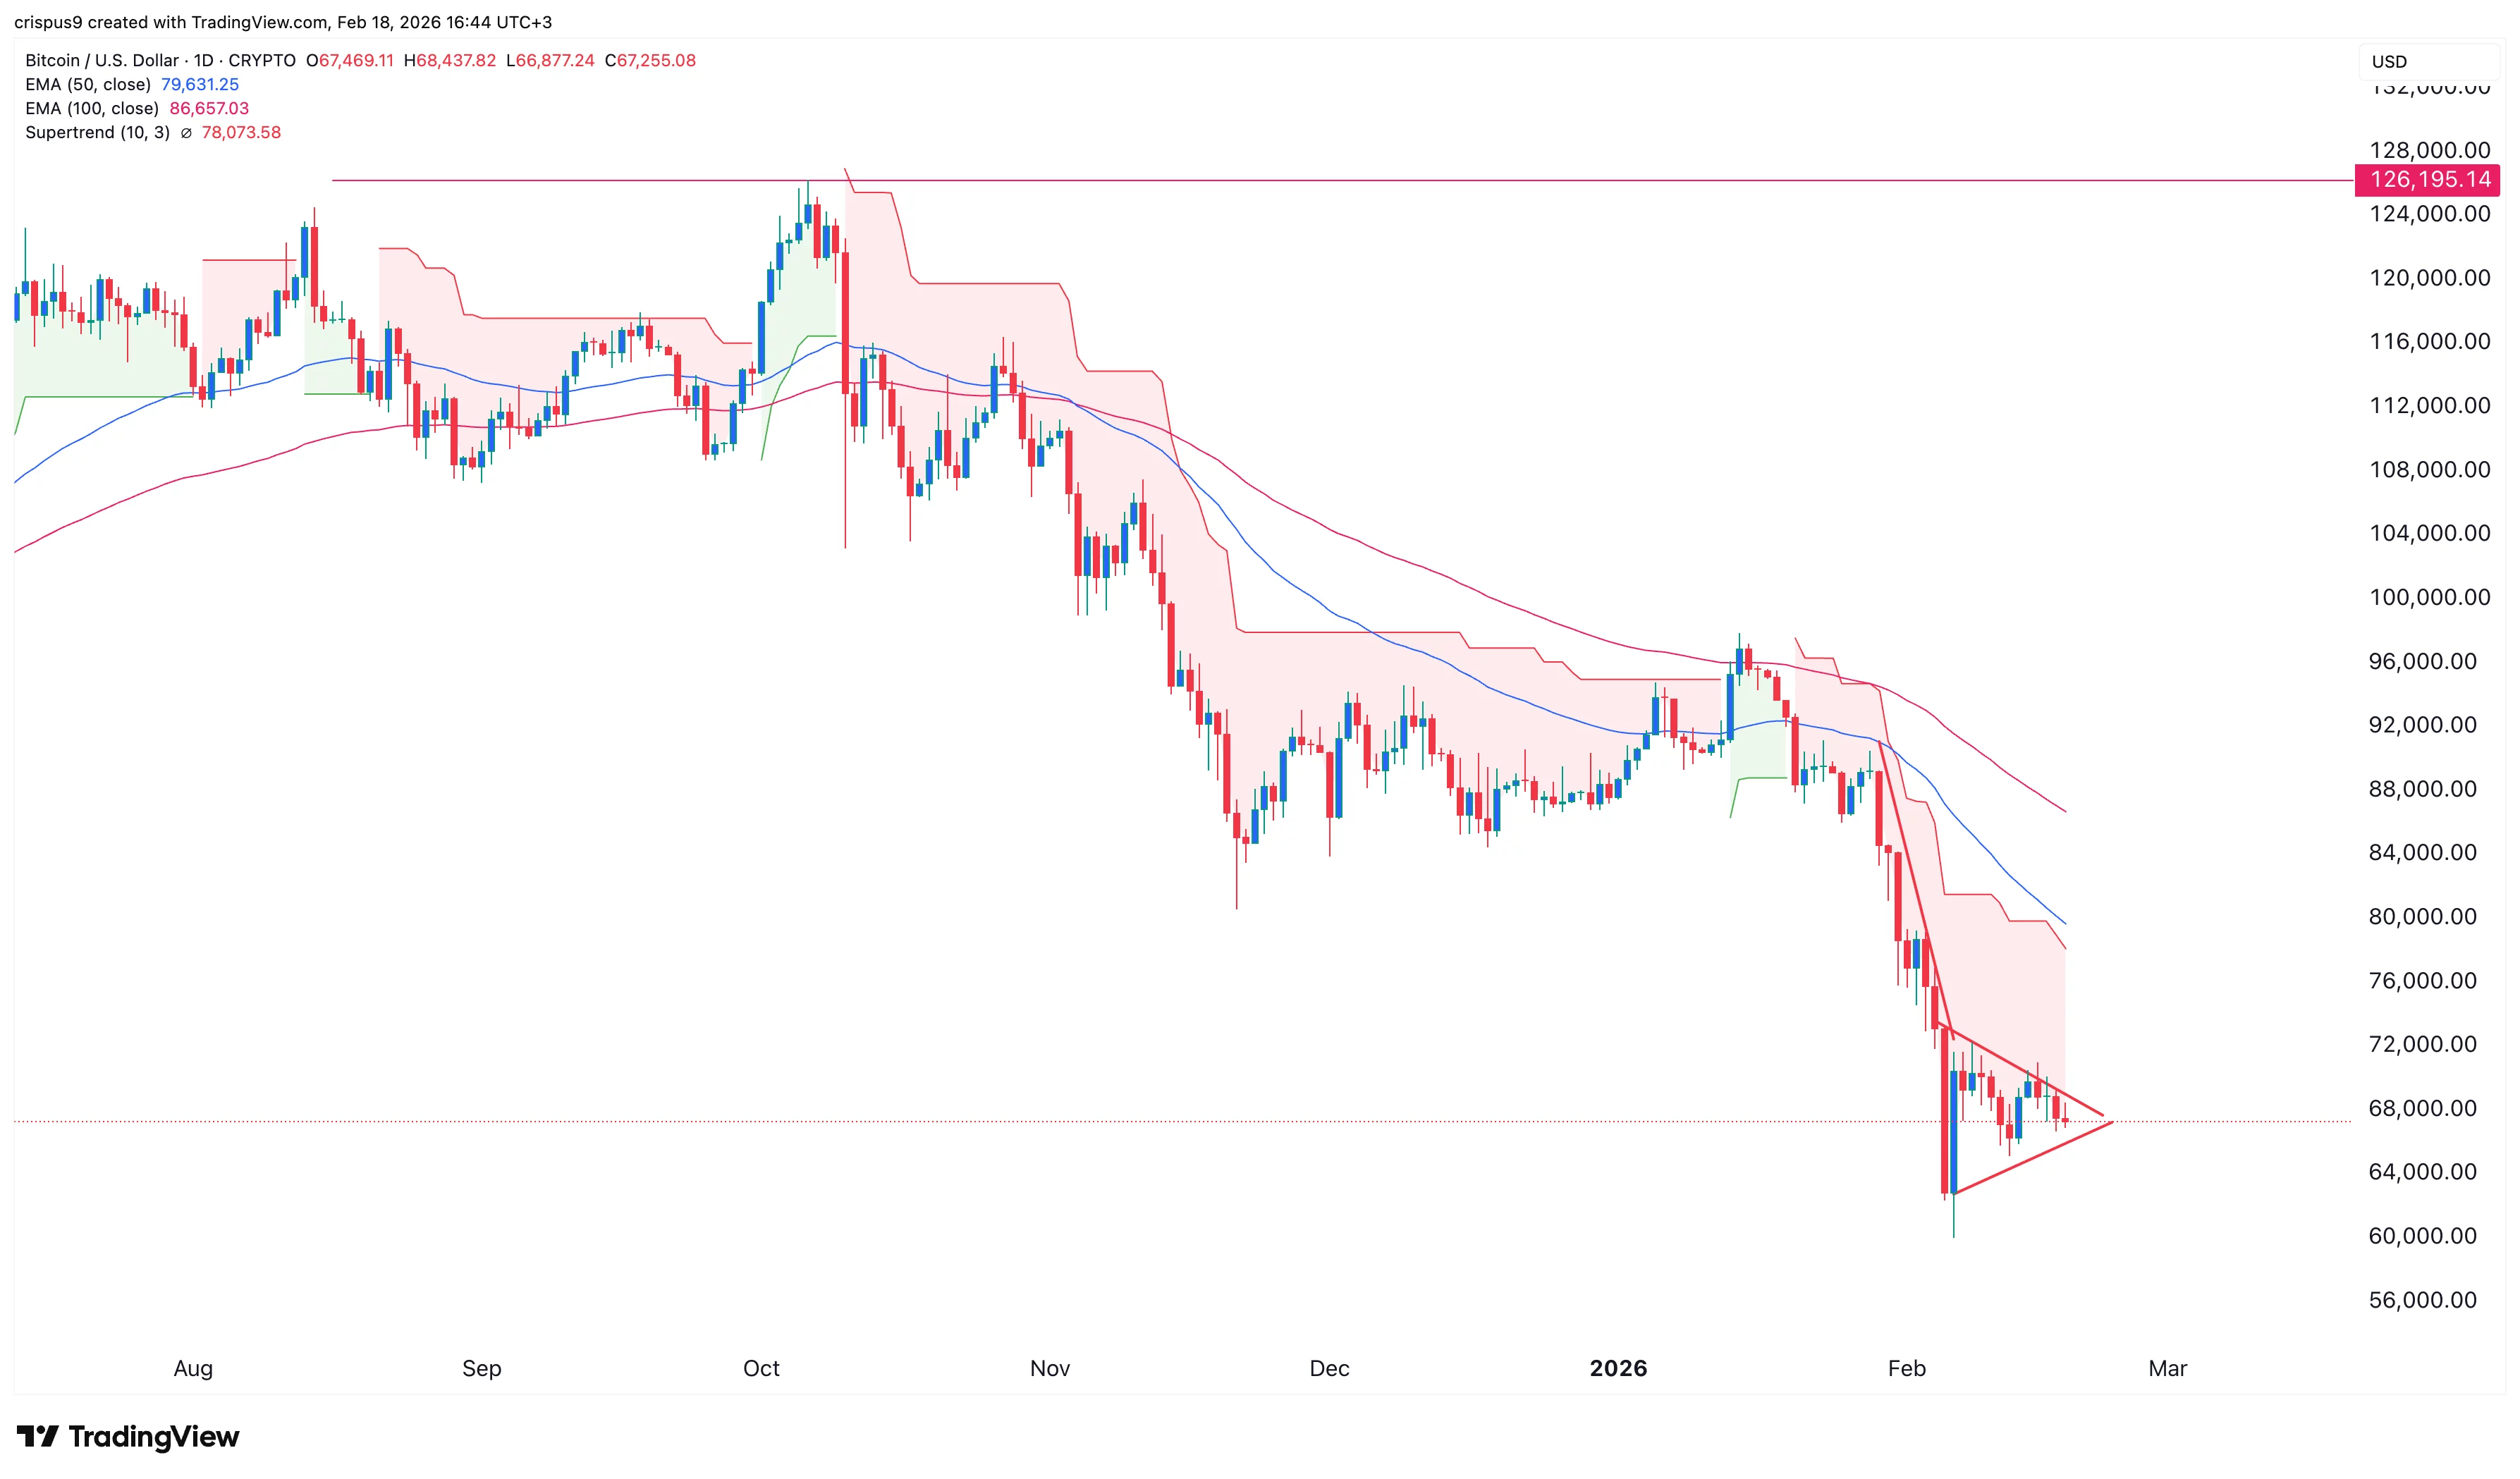
The daily timeframe chart shows that Bitcoin price is flashing red alerts. For example, the coin is slowly forming a large bearish pennant pattern. It has already completed forming the vertical line and is now in the process of forming the triangle section.
The Supertrend indicator has remained red since January 19 this year. It has also remained below the 50-day and 100-day Exponential Moving Averages.
Therefore, the coin will likely continue falling, with the initial target being the year-to-date low of $60,000. A drop below that level will signal further downside, potentially to the psychological $50,000 level, as Standard Chartered analysts predicted last week.


You May Also Like

UK crypto holders brace for FCA’s expanded regulatory reach

Bitcoin Exchange Binance Announces New Listings on its Futures Platform! Here Are the Details