Building a CBIR Benchmark with TotalSegmentator and FAISS
Table of Links
Abstract and 1. Introduction
-
Materials and Methods
2.1 Vector Database and Indexing
2.2 Feature Extractors
2.3 Dataset and Pre-processing
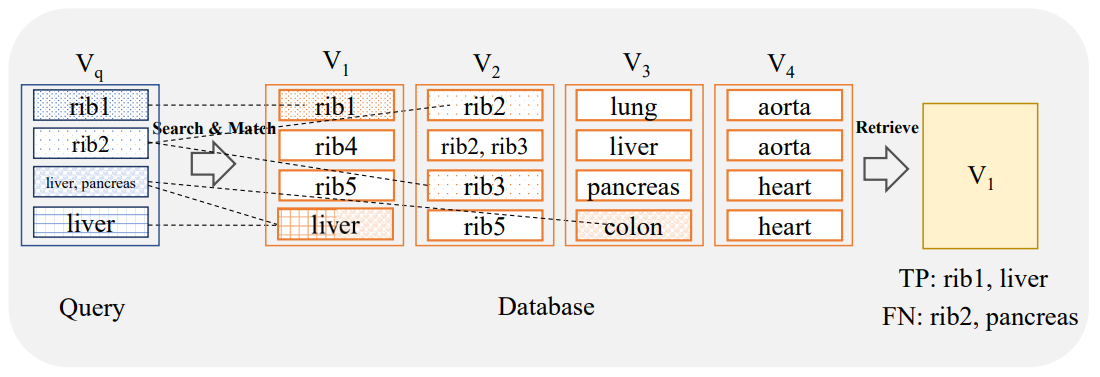
2.4 Search and Retrieval
2.5 Re-ranking retrieval and evaluation
-
Evaluation and 3.1 Search and Retrieval
3.2 Re-ranking
-
Discussion
4.1 Dataset and 4.2 Re-ranking
4.3 Embeddings
4.4 Volume-based, Region-based and Localized Retrieval and 4.5 Localization-ratio
-
Conclusion, Acknowledgement, and References
2 Materials and Methods
2.1 Vector Database and Indexing
In the context of image search a database typically constitutes the central location where all the representations of the images, a.k.a. embeddings, and their metadata including annotations are stored. A query allows the user or the system to request specific images in various ways, e.g., by inputting a reference image or a textual description. The
\ ![Figure 1: Overview of a retrieval system based on Khun Jush et al. [2023]: Step 1: 2D slices are extracted from the 3D volumes. Step 2: Feature extractors are used to extract the embeddings from the database slices and query volumes. Step 3: Database embeddings are indexed using HNSW or LSH indexing. Step 4: Search and slice retrieval is performed, and a hit-table is saved (the hit-table shows the occurrence of volume-ids per each query volume or region saved along with the sum of its total score). Step 5: The results from slice retrieval are aggregated to retrieve the final volume.](https://cdn.hackernoon.com/images/null-3j033c1.png)
\ goal is to search the database for similar images that match the query. Similarly, in this study, the search process entails comparing a query image with images in the database to identify the most similar image using the cosine similarity of the embeddings. Throughout this process, we do not depend on any metadata information at any stage. Metadata-independence is an intended design choice and in contrast to widely used metadata-based image retrieval solutions that frequently lack the necessary specificity in real-world retrieval applications. In small sets, the similarity search is easy but with the growing size of the database, the complexity increases. Accuracy and speed are the key factors in search, thus, naive approaches typically fail in huge datasets.
\ Indexing in the context of content-based image search involves creating a structured system that allows for efficient storage and retrieval of images based on their visual content. A flat index is the simplest form of indexing, where no modification is made to the vectors before they are used for search. In flat indexing, the query vector is compared to every other full-size vector in the database and their distances are calculated. The nearest k of the searched spaces is then returned as the k-nearest neighbors (kNN). While this method is the most accurate, it comes at the cost of significant search time [Aumüller et al., 2020]. To improve search time, two approaches can be employed: reducing the vector size through dimensionality reduction, e.g., by reducing the number of bits representing each vector, or reducing the search scope by clustering or organizing vectors into tree structures based on similarity or distance. This results in the identification of an approximation of the true nearest neighbors, known as approximate nearest neighbor search (ANN) [Aumüller et al., 2020].
\ There are several ANN methods available. In the context of content-based volumetric medical image retrieval, Khun Jush et al. [2023] compared Locality Sensitive Hashing (LSH) Charikar [2002] and Hierarchical Navigable Small World (HNSW) Malkov and Yashunin [2018] for indexing and search. LSH hashes data points in a way that similar data points are mapped to the same buckets with higher probabilities. This allows for a more efficient search for nearest neighbors by reducing the number of candidates to be examined. HNSW [Malkov and Yashunin, 2018] indexing organizes data into a hierarchical graph structure where each layer of the hierarchy has a lower resolution. The top layer connects data points directly, but the lower layers have fewer connections. The graph structure is designed to allow for efficient navigation during the search. Compared to LSH, HNSW typically enables faster search and requires less memory Taha et al. [2024]. Based on findings in [Khun Jush et al., 2023] HSNW was chosen as the indexing method in the setting of this study due to speed advantages over LSH at a comparable recall. There are various index solutions available to store and search vectors. In this study, we used the Facebook AI Similarity Search (FAISS) package that enables fast similarity search [Johnson et al., 2019]. The indexing process involves running the feature extractors on slices of each volumetric image and storing the output embeddings per slice. The produced representations are then added to the search index which is used later on for vector-similarity-based retrieval.
2.3 Dataset and Pre-processing
We designed a CBIR benchmark relying on the publicly available TotalSegmentator (TS) dataset Wasserthal et al. [2023], version 1. This dataset comprises in total of 1204 computed tomography (CT) volumes covering 104 anatomical structure annotations (TS, V1). The anatomical regions presented in the original dataset include several fine-grained sub-classes for which we considered an aggregation to a coarser common class as a reasonable measure, e.g., all the rib classes are mapped to a single class ‘rib’. The coarse organ labels can help identify similarities and potential mismatches between neighboring anatomical regions, providing valuable insights into the proximity information of the target organ. Table 1 shows the mapping of the original TS classes to the coarse aggregated classes. For the sake of reproducibility, the query cases are sourced from the original TS test split, while the cases contained in the original TS train and validation set serve as the database for searching. The search is assessed on the retrieval rate of 29 coarse anatomical structures and 104 original TS anatomical structures.
\ The models presented in Section 2.2 are 2D models used without fine-tuning to extract the embeddings. Thus, per each 3D volume, individual 2D slices of the corresponding 3D volumes are utilized for embedding extraction. The input size for all the used models is equal to 224 × 224 pixels with image replication along the RGB channel axis. For all the ViT-based models and the ResNet50 trained on fractal images, images are normalized to the ImageNet
\ \ 
\ \ mean and standard deviation of (.485, .456, .406) and (.229, .224, .225), respectively. For the SwinTransformer and the ResNet50 model pre-trained on the RadImageNet dataset, the images are normalized to .5 mean and .5 standard deviation based on Mei et al. [2022]. The total size of the database is 290757 embeddings, while the final query set of the test set comprises 20442 embeddings.
\
:::info Authors:
(1) Farnaz Khun Jush, Bayer AG, Berlin, Germany (farnaz.khunjush@bayer.com);
(2) Steffen Vogler, Bayer AG, Berlin, Germany (steffen.vogler@bayer.com);
(3) Tuan Truong, Bayer AG, Berlin, Germany (tuan.truong@bayer.com);
(4) Matthias Lenga, Bayer AG, Berlin, Germany (matthias.lenga@bayer.com).
:::
:::info This paper is available on arxiv under CC BY 4.0 DEED license.
:::
\


You May Also Like

How Stablecoins Are Changing Business Payments

Lowe’s (LOW) Stock Falls After Earnings Beat Gets Overshadowed by Weak Guidance