

The Final Verdict: Is Pair Programming Worth the Effort?
Table of Links
Abstract and 1. Introduction
-
Background and 2.1. Related Work
2.2. The Impact of XP Practices on Software Productivity and Quality
2.3. Bayesian Network Modelling
-
Model Design
3.1. Model Overview
3.2. Team Velocity Model
3.3. Defected Story Points Model
-
Model Validation
4.1. Experiments Setup
4.2. Results and Discussion
-
Conclusions and References
4.2. Results and Discussion
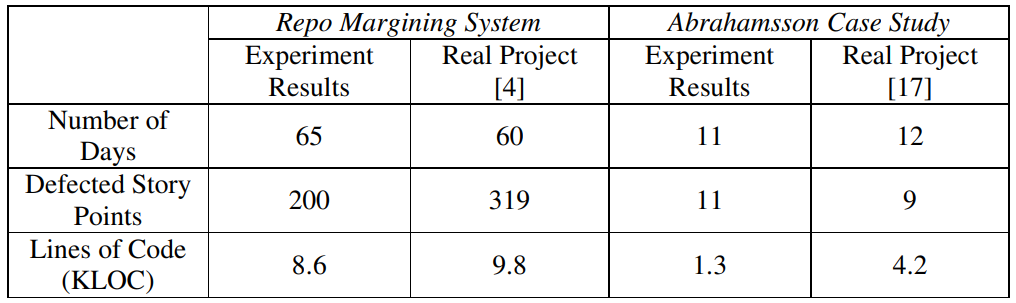
Table 5 shows a comparison between the Estimated and the Real values for the two projects. Regarding the number of days, the estimated number is so close to the Real project. This indicates the acceptable accuracy of the proposed Team Velocity Model. On the other hand, the Defected Story Points model was not that accurate. For Abrahamsson Case Study, the estimated number of defected story points was close to the actual one, while for the Repo Margining System, the accuracy of the prediction system was not that good. The inaccuracy also appears in estimated the produced number of Line of codes for Abrahamsson Case Study.
\ The imprecision in some of the results, especially in the Defected Story Points model, is due to fixing some variables that should not be fixed. For example, the Defect Injection Ratio was fixed for the two projects to follow the normal distribution with mean 20 defects per KLOC. This value differs from project to another and should not be fixed. The same for Developer Productivity random variable that set to follow the normal distribution with mean 40 lines/day. This also depends on the nature of the project and should vary from project to another.
\ 
\ One solution of such imprecision is to adopt the model for self-learning, by which the model can learn from the first iterations and adjust different parameters and variables. This increases the confidence of the prediction and can correct the model’s prior assumptions. This learning capability is a good extension for the proposed model.
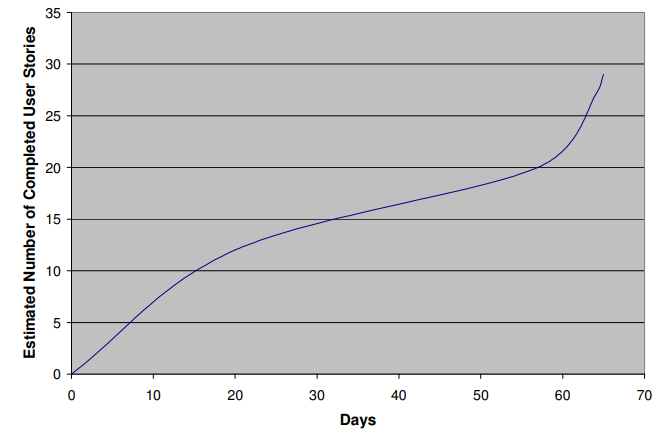
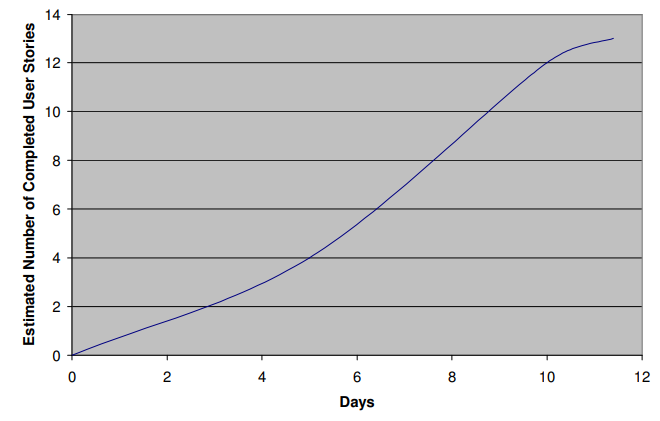
\ Figures 6 and 7 show the estimated project status as time passes. Those curves gave accurate estimated values for the project finish time. Those curves can be obtained in the project planning phase before starting the actual development using very simple input data. Using such curves, the success or the failure of the project can be detected in early stage.
\ 
\ 
\
:::info Authors:
(1) Mohamed Abouelelam, Software System Engineering, University of Regina, Regina, Canada;
(2) Luigi Benedicenti, Software System Engineering, University of Regina, Regina, Canada.
:::
:::info This paper is available on arxiv under CC BY-NC-ND 4.0 DEED license.
:::
\


You May Also Like

Ultimate Guide: Top No Deposit Bonus Casinos to Win Big


