

Dogecoin price nears bullish triangle breakout, can it recover to its February highs?
Dogecoin price is close to confirming a bullish breakout from a symmetrical triangle pattern amid a surge in demand on the derivatives market.
- Dogecoin price hit weekly high after reports of U.S.-Iran negotiations calmed investor fears.
- Dogecoin is close to confirming a bullish symmetrical triangle breakout.
Dogecoin (DOGE) price shot up 17% to a weekly high of $0.103 on Thursday morning Asian time before settling at $0.096 at press time.
Dogecoin’s rally was supported by investor fears cooling off after reports surfaced that Iran has secretly been negotiating a deal with the U.S. to de-escalate the ongoing conflict between the two nations.
A look at its futures market shows that more investors are now betting in favor of a Dogecoin rally.
According to CoinGlass data weighted funding rate for Dogecoin has turned positive, signalling that long traders are paying short traders to maintain their positions as they anticipate further gains. Such conditions tend to influence retail sentiment positively.
Dogecoin price eyes symmetrical triangle breakout
On the daily chart, Dogecoin price is close to confirming a breakout from the upper side of a symmetrical triangle pattern. When an asset breaks out from the upper side of a symmetrical triangle, it is viewed as a very positive signal and typically marks the beginning of a sustained bullish trend.
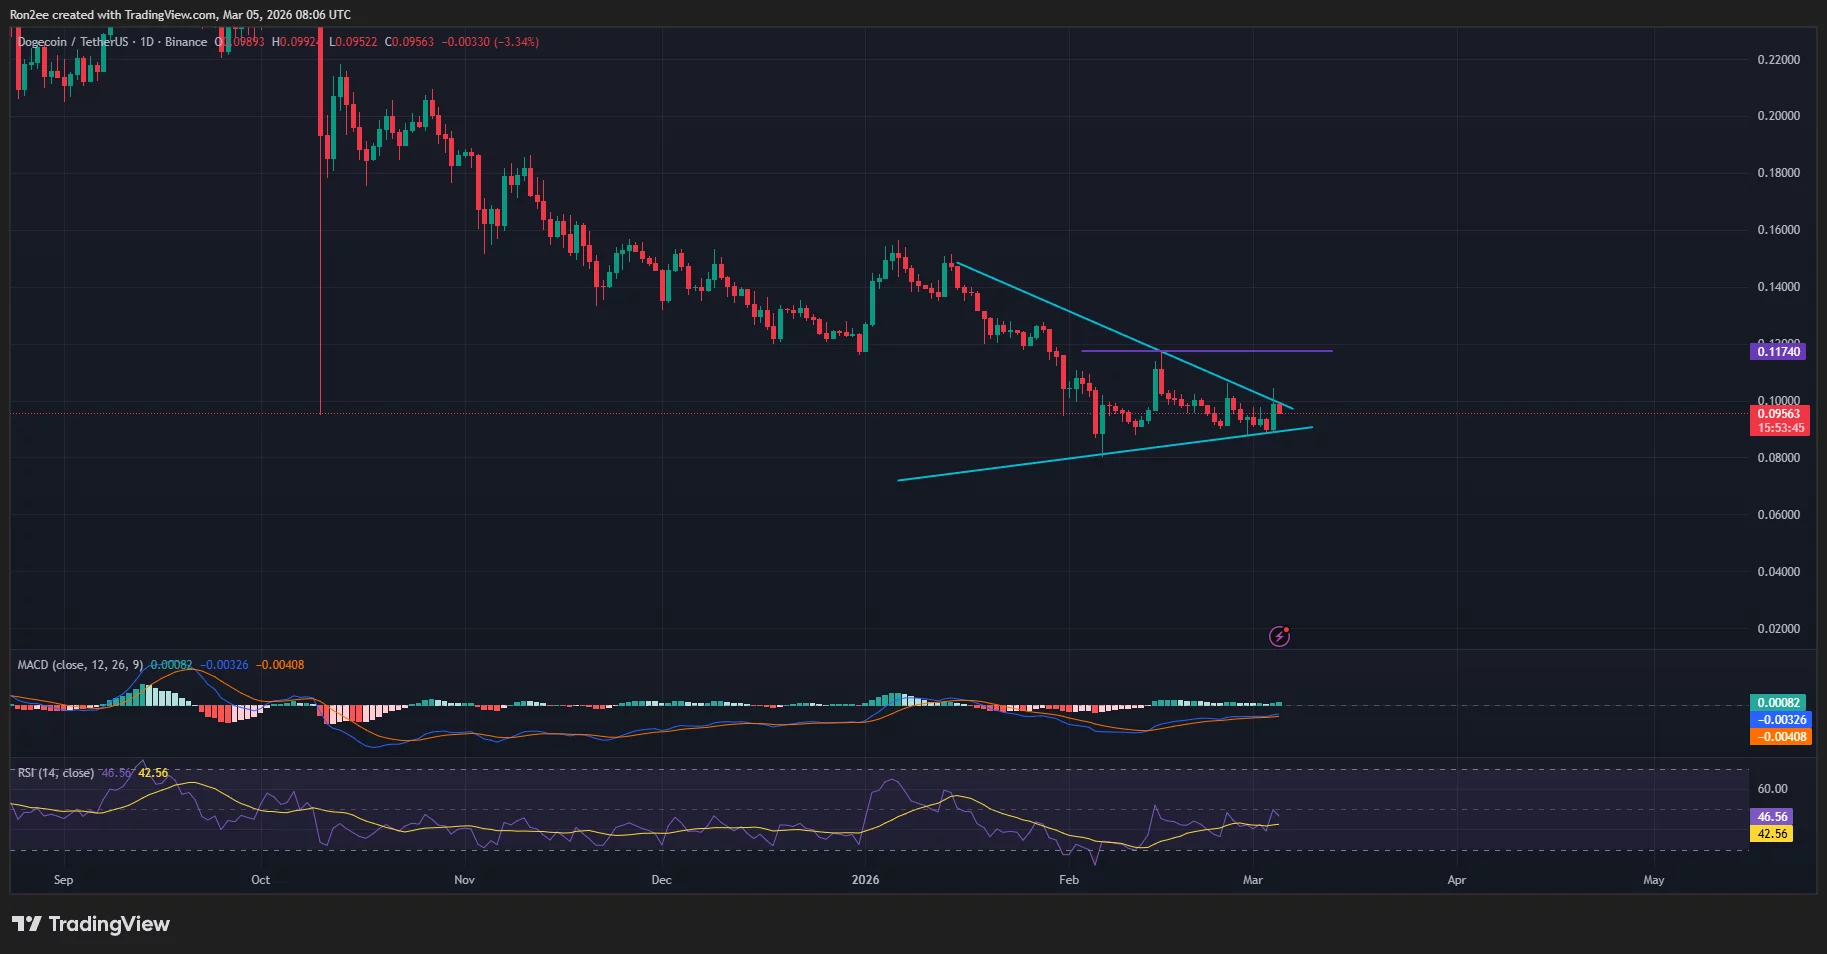
For Dogecoin, a breakout from the pattern could trigger bulls to aggressively push the price to reclaim its February high of around $0.117.
Momentum indicators like the MACD and RSI seem to support the bullish path. The MACD lines were moving upwards while the RSI was close to breaking out of the neutral threshold, which is often the spark needed for a massive rally during periods of high market volatility.
However, it should be noted that a break below the $0.080 support would invalidate the bullish setup.
Meanwhile, a major headwind for Dogecoin is the weak demand for spot ETFs tied to the meme coin, which could limit any sustained rally.
Notably, the three spot DOGE ETFs have so far managed to draw in only $7.45 million in net inflows since their launch in November. These institutional products had gone through a month of no flows before attracting only $779,000 in inflows on March 2.
Traders may see the muted involvement from major investors as a sign that institutional players remain unconvinced about the meme coin’s long-term prospects, even as retail demand stays strong.
Disclosure: This article does not represent investment advice. The content and materials featured on this page are for educational purposes only.
You May Also Like

a16z Targets $2 Billion Crypto Fund as Venture Capital Eyes Blockchain Recovery

Will XRP Price Increase In September 2025?
