Bitcoin Finds Crucial Support On Bull Market Band — Will Momentum Hold
Bitcoin price is currently at a critical juncture, sitting right on top of the Bull Market Support Band. Throughout past bull cycles, this band has historically served as a crucial support level, with price retesting it during corrections and bouncing off it to continue its upward trend.
Why This Level Matters For Bitcoin Uptrend
In an X post, full-time crypto trader and investor, Daan Crypto Trades, has pointed out that Bitcoin is currently sitting directly on top of the Bull Market Support Band. This level has long been regarded as one of the most reliable high-timeframe momentum indicators.
Daan Crypto Trades noted that while Bitcoin has seen short-term consolidation at or even slightly below this band, it has never experienced a prolonged detachment for more than a week or two during a bull market.
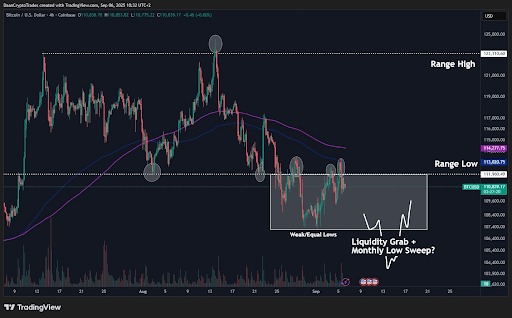
The broader market structure remains intact as long as Bitcoin continues to print higher highs and higher lows on the larger timeframe. However, any subsequent dips that occur while this structural integrity is maintained are generally seen as areas of interest and potential buying opportunities for investors.
The Role Of Liquidity In Driving Bitcoin’s Next Move
Bitcoin is showing the first bearish divergence against the Global M2 Money supply since the cycle lows began, and signaling a potential slowdown in momentum. According to Saint Pump, a market expert, a one-month liquidity pullback is expected in late September, coinciding with the Federal Reserve (Fed) anticipated rate cut amid job weakness.
This confluence of a bearish technical signal and a macroeconomic liquidity event suggests that BTC’s recent poor price action since July and divergence with global liquidity will continue leading to a period of choppy price action. In addition, there will be volatile trading until global liquidity conditions improve in late October. Adding to the short-term pressure, October also marks the expected end of the four-year cycle, which historically brings additional selling activity.
Despite these headwinds, no major cycle top or euphoria signals are evident. Saint Pump noted that the Trump Administration may unleash a monetary bazooka through a Fed takeover to stimulate the economy ahead of the midterms. As a result, this cycle could extend into late 2026, until Inflation fears resurface once the Fed overdoes it due to political pressures.
From a technical perspective, the best bid scenario in a sell-off lies between $93,000 and $98,000, aligning with a retest of the weekly 55 Exponential Moving Average (EMA), which has sustained the bull trend since last year. While short-term volatility is expected, the broader uptrend remains structurally sound.


You May Also Like

Quantum-Safe Bitcoin Proposal Offers Emergency Protection Without Network Upgrade

Nobel winner says Trump just made 'America's weakness' clear with one foolish move