Stress-Test Node & Link Models with One Click: Meet HypNF
Table of Links
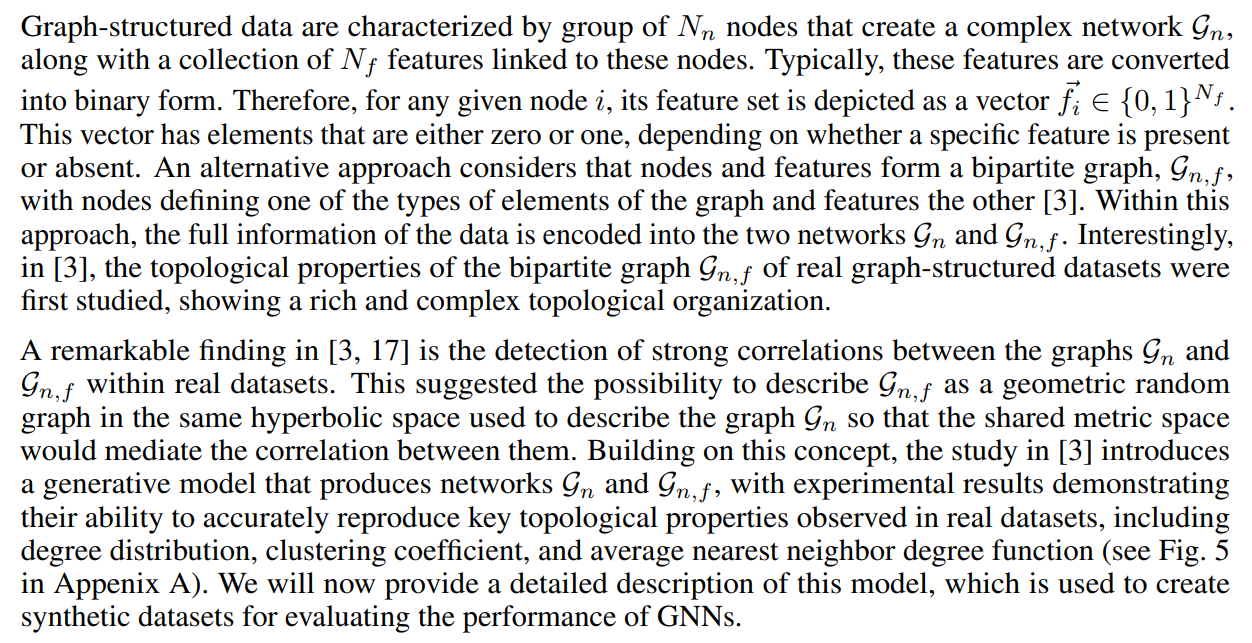
Abstract and 1. Introduction
-
Related work
-
HypNF Model
3.1 HypNF Model
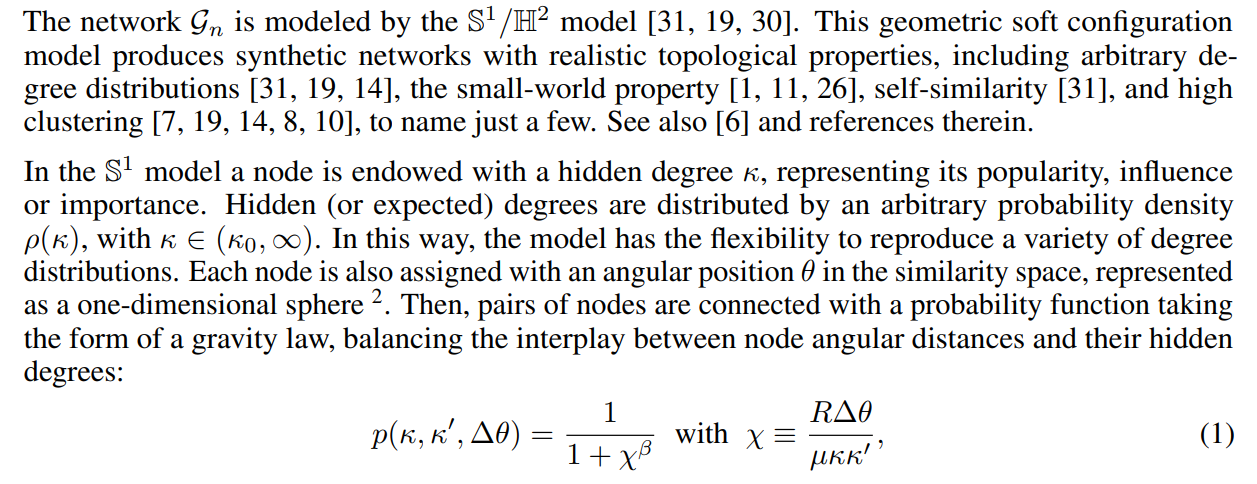
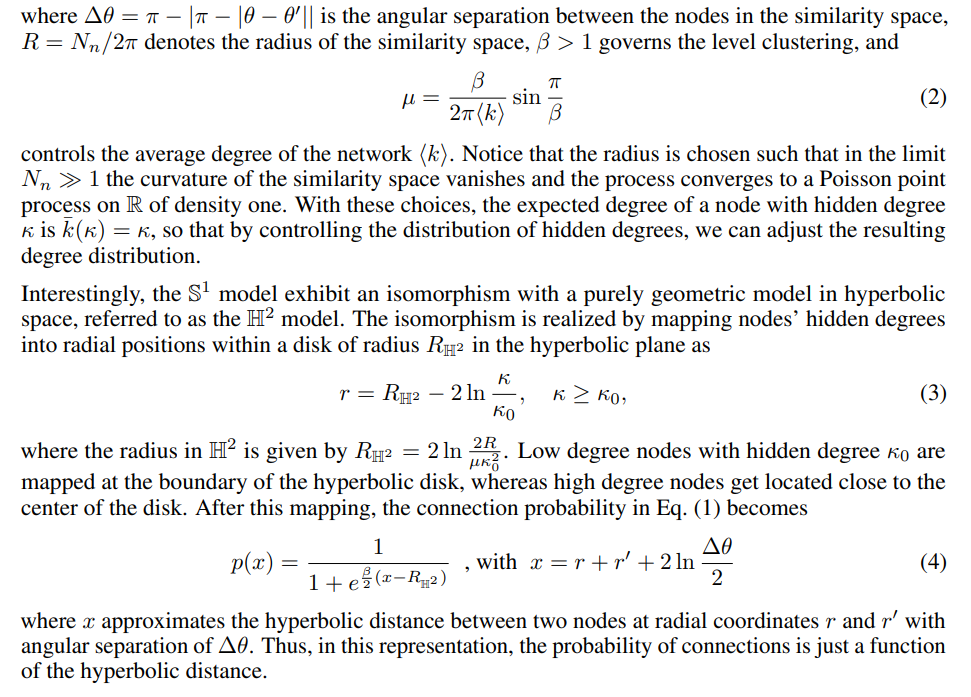
3.2 The S1/H2 model
3.3 Assigning labels to nodes
-
HypNF benchmarking framework
-
Experiments
5.1 Parameter Space
5.2 Machine learning models
-
Results
-
Conclusion, Acknowledgments and Disclosure of Funding, and References
\
A. Empirical validation of HypNF
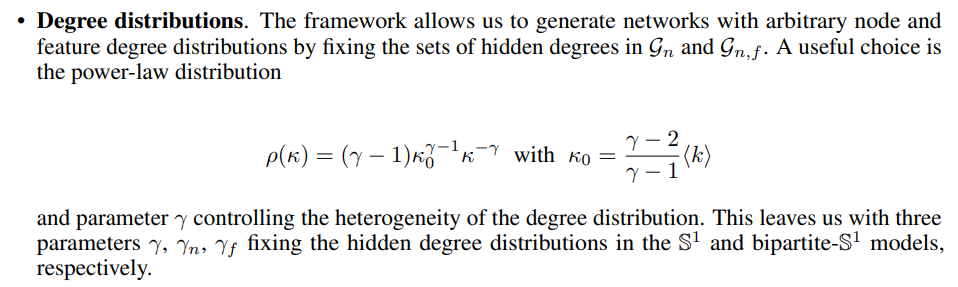
B. Degree distribution and clustering control in HypNF
C. Hyperparameters of the machine learning models
D. Fluctuations in the performance of machine learning models
E. Homophily in the synthetic networks
F. Exploring the parameters’ space
3 HypNF Model
\
3.1 The S1/H2 model
\ 
\ 
\ 
\
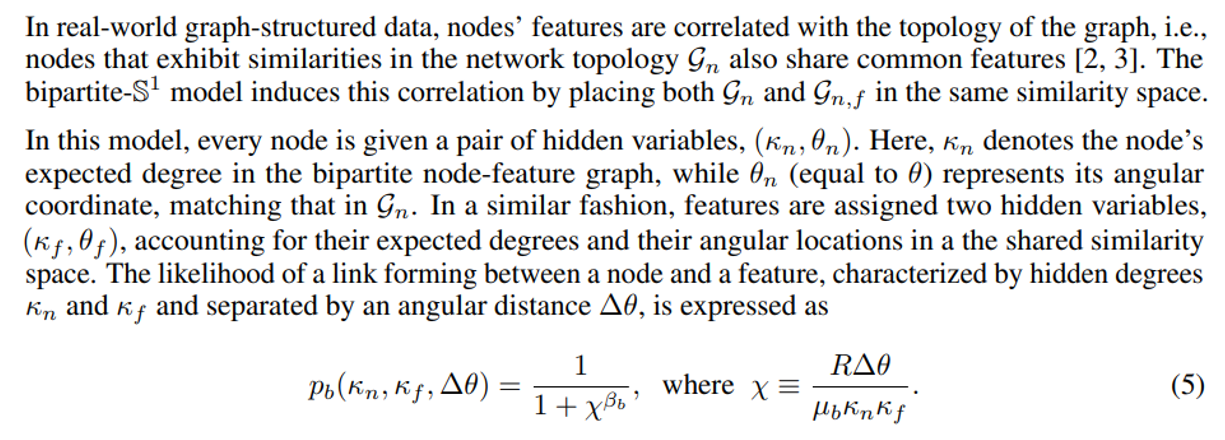
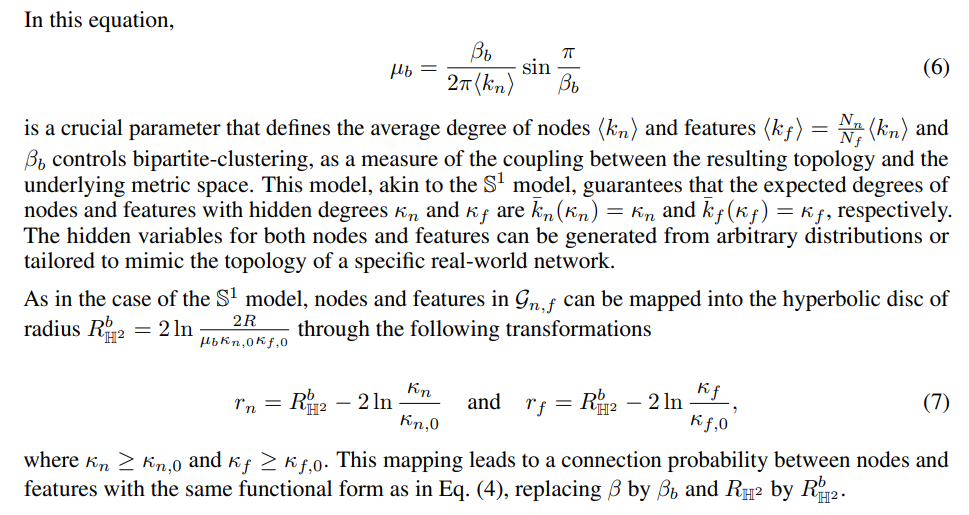
3.2 The bipartite-S1/H2 model
\ 
\ 
\
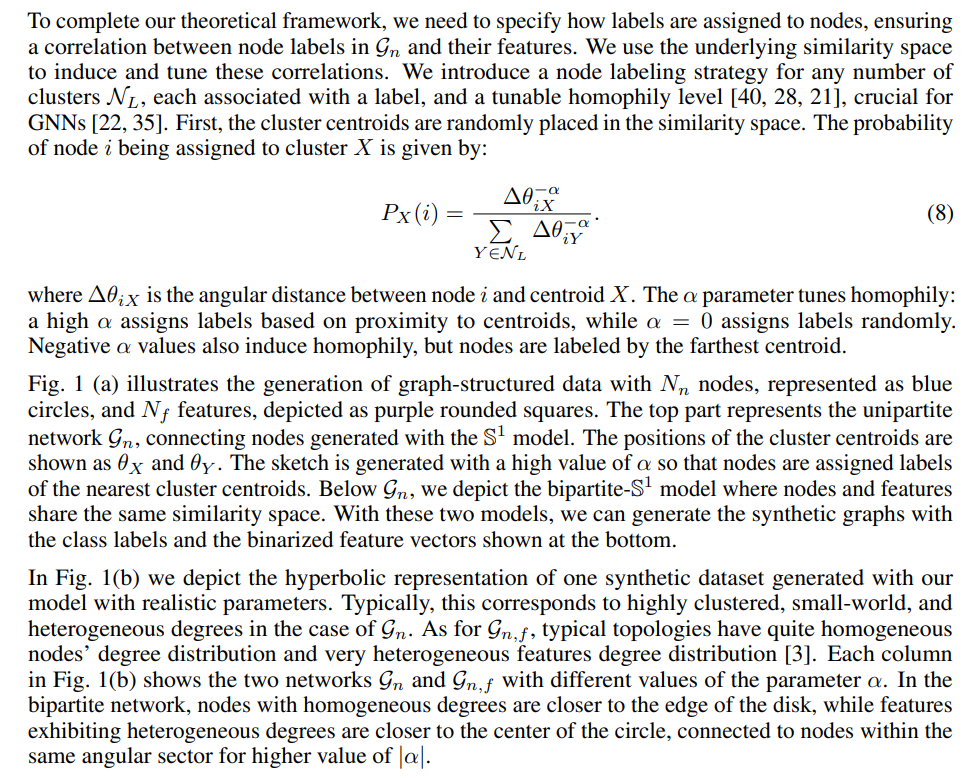
3.3 Assigning labels to nodes
\ 
\
4 HypNF benchmarking framework
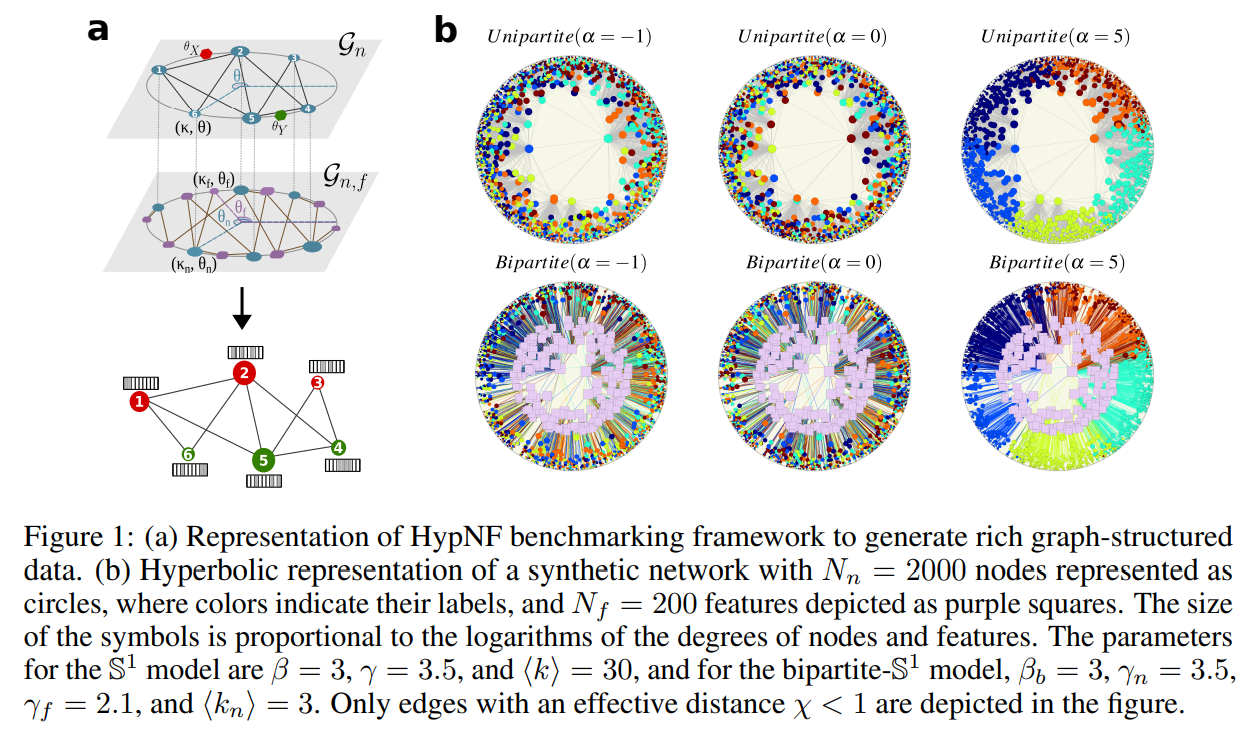
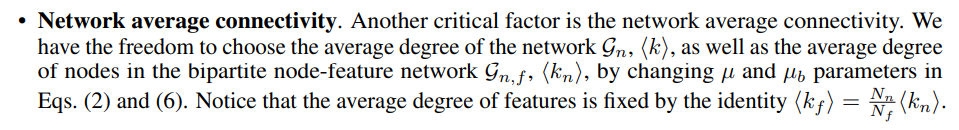
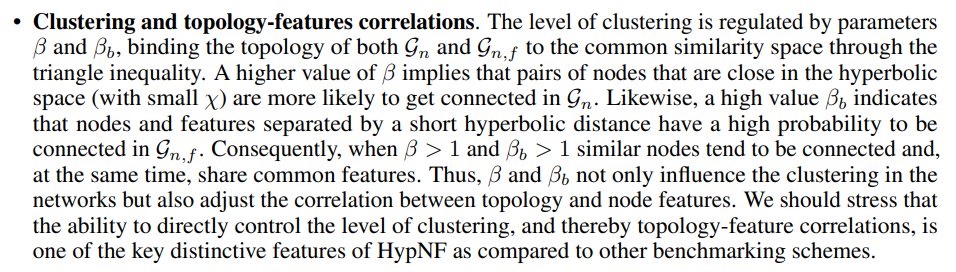
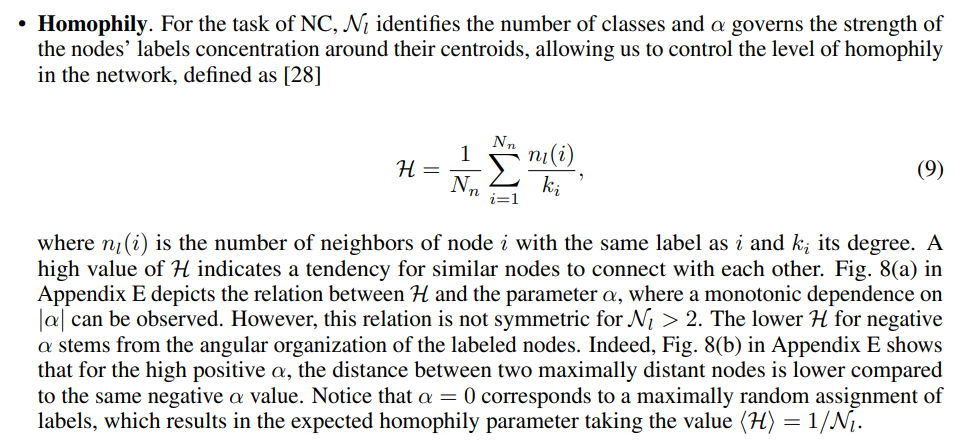
The HypNF benchmarking framework depicted in Fig. 1 combines the S1/H2 and bipartite-S1/H2 models within a unified similarity space. Additionally, it incorporates a method for label assignment. This integration facilitates the creation of networks exhibiting a wide range of structural properties and varying degrees of correlation between nodes and their features. Specifically, our framework allows us to control the following properties:
\ 
\ 
\ 
\ 
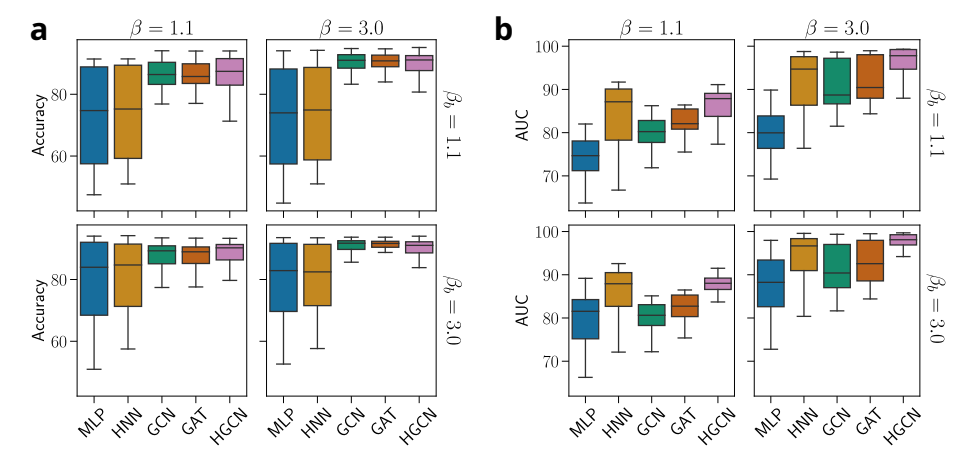
\ Leveraging the HypNF model with varying parameters, our benchmarking framework generates diverse graph-structured data. This allows for the evaluation of graph machine learning models on networks with different connectivity patterns and correlations between topology and node features. For tasks like NC and LP, the framework facilitates fair model comparisons, helping to assess a novel GNN against state-of-the-art architectures and providing insights into the data’s impact on performance.
\ 
\
:::info Authors:
(1) Roya Aliakbarisani, this author contributed equally from Universitat de Barcelona & UBICS (roya_aliakbarisani@ub.edu);
(2) Robert Jankowski, this author contributed equally from Universitat de Barcelona & UBICS (robert.jankowski@ub.edu);
(3) M. Ángeles Serrano, Universitat de Barcelona, UBICS & ICREA (marian.serrano@ub.edu);
(4) Marián Boguñá, Universitat de Barcelona & UBICS (marian.boguna@ub.edu).
:::
:::info This paper is available on arxiv under CC by 4.0 Deed (Attribution 4.0 International) license.
:::
\


You May Also Like

RAVE Price Surges by 85% as Liquidations Spike Across Crypto Markets

The Bitcoin Price Prediction That Could Change Everything as Pepeto Presale Fills Before Listing