

Spend Less on Ads, Get More SEO: A Smarter Growth Play
An unconventional way to optimize your marketing campaign, spend less on Ads and get better SEO results for free.
A letter from the founder. On evolution, markets, growth, business models, content, marketing, Ads, SEO, and graphs.
When I started the Year of the Graph back in 2018, I was pretty green as far as marketing goes. That’s another way of saying – I didn’t know, like, or care much about it at all. I didn’t have anyone to help me either.
All I wanted to do was simple, in my mind. I wanted to use my knowledge of the knowledge graph and graph database market and do something useful with it: write what set out to be the definitive report on graph databases.
It was a very ambitious project which took lots of time and effort. That, and my naivete, was what made me start the Year of the Graph. This is the story of how it started, how it’s going, what I learned in the process and what you can get out of it.
Birth: What is the Year of the Graph
Everything is connected. Graphs exist to model connections. This is why Graphs are everywhere.
The Year of the Graph is a central node for all things Graph. It’s here to record, analyze, and connect.
Its goal is to help people get started with and keep track of all things Graph Year over Year.
![]()
The Year of the Graph is a central node for all things Graph. It’s here to record, analyze, and connect.
The Year of the Graph features a collection of resources, a curated quarterly newsletter featuring editorial and a collection of news from industry and research, as well as reports.
The original thinking behind it went something like this.
As part of my job as an analyst, I keep an eye on all things graph – Knowledge Graphs, Graph Databases, Graph Analytics, Graph Data Science and AI. I scan, evaluate and synthesize a large volume of news, reports, and other signals.
This is work I do anyway, so why not make something out of it, by sharing it with others who may find this interesting? The upside for me would be building an audience that could eventually be potential buyers for the report.
That was the birth of the Year of the Graph newsletter in 2018. Fast forward to 2025, and a lot of things have changed. Not the name though – every year is the Year of the Graph now!
Growth: From a side project to the stars
Graph went from an emerging technology niche to an established market worth billions and rising with the AI tide. The Year of the Graph newsletter oscillated between a monthly cadence and periods of hiatus. From few and far between items to abundance, making curation and synthesis harder every time.
I experimented with various formats and styles. In a learning process, inevitably not everything works out. The original idea turned out to be a dud. The first version of the Year of the GRaph database report in 2018 won expert recognition, but not a wide audience. The second version in 2021 was delivered via GigaOm, and it’s hard to evaluate how the YotG audience responded to it.
But during all this time, awareness and market share have been progressing. The graph market has been growing alongside the audience. New segments and channels were added, and the the branding and distribution of the YotG have been evolving. Let’s check some numbers.
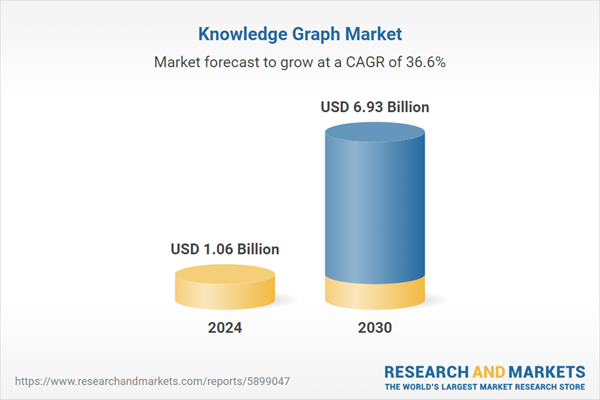
The knowledge graph market is estimated at USD 1.06 billion in 2024 to USD 6.93 billion by 2030, at a Compound Annual Growth Rate (CAGR) of 36.6%.
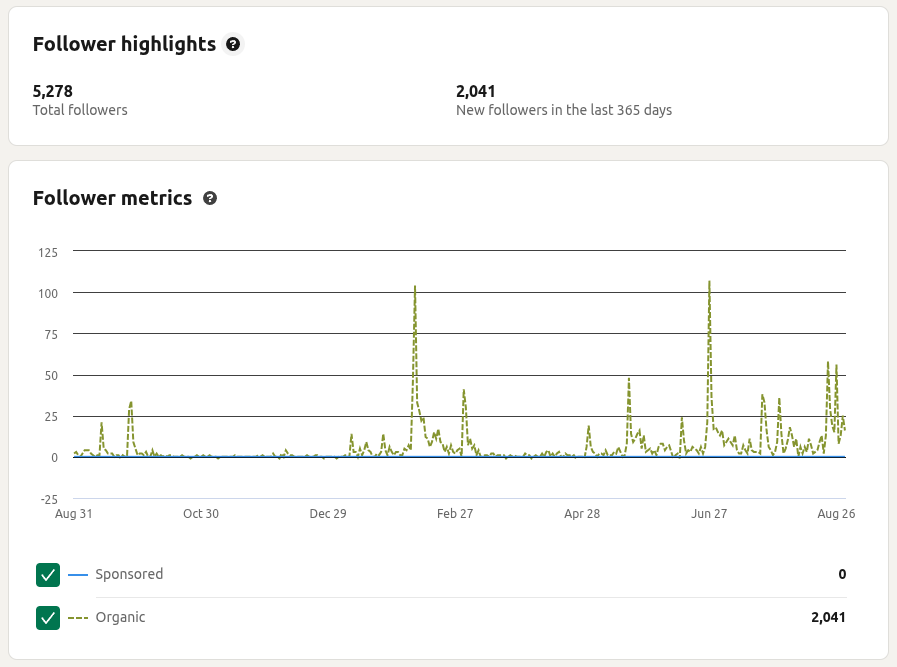
The Year of the Graph’s audience has grown from ~5K to ~7,5K total followers / subscribers between 2024 and 2025. This purely organic growth far exceeds the projected CAGR for the market at 50% YoY, with LinkedIn growing at 63% YoY.
In fact, it was hitting a milestone on LinkedIn – exceeding 5K followers – that was the inspiration for writing this account. Arbitrary as they may be, milestones are more than a good excuse to celebrate: they are occasions to reflect.
The problem: Ads don’t work
Even though marketing is still not my favorite thing in the world, it’s something I had to learn as a solopreneur. In 2025, I’ve reached a point where in addition to successfully using it myself, I offer Content Marketing services and courses to others.
I’ve also had my fair share of using Ads, on LinkedIn and elsewhere. LinkedIn is more than the most prominent social network for professionals. In theory, LinkedIn is also supposed to be the most sophisticated / effective way to advertise.
In practice, however, my experience has been less than great. TL;DR: I haven’t found that LinkedIn ads are really worth it. In the campaigns I’ve run, either via agencies or myself, LinkedIn Ads cost me between 5 – 10 Euro per click.
This is not factoring in the overhead in time and money. You have to spend time to learn how things work and then to design, launch, manage, fine-tune and evaluate campaigns. You have to spend time and money to hire and manage agencies.
But most importantly: these clicks do not turn to conversion. Over multiple campaigns, results have been consistently underwhelming.
Things are even worse for other platforms. For Google Ads, the average cost for B2B is ~4,5 USD, and for SaaS it’s ~23,6 USD – plus overhead. No conversion. Twitter and Facebook..let’s not even go there. This is why I’ve pretty much given up on Ads on any platform.
Maybe Ads work better for other domains, or other products. Or maybe I’m doing something wrong. But this experience is shared among pretty much everyone else I’ve discussed this with.
This, and the combined market, audience, brand and personal growth led to the next evolutionary stage for the Year of the Graph.
Evolution: Spend less on Ads and get better SEO for free
As of the Summer 2025 issue, the Year of the Graph newsletter features sponsors. The idea is simple, the benefits are many, the data is in, and it looks very – very promising.
To clarify, nothing changes in the criteria for inclusion in the newsletter. This always has been and will be on a meritocratic basis: I simply include what I find relevant and interesting, and nobody pays me to do this.
What has changed is that going forward, anyone who wants to support the work that goes into the Year of the Graph and reach its audience can become a sponsor. Sponsors have their Ad – text, logo and image – included in the newsletter.
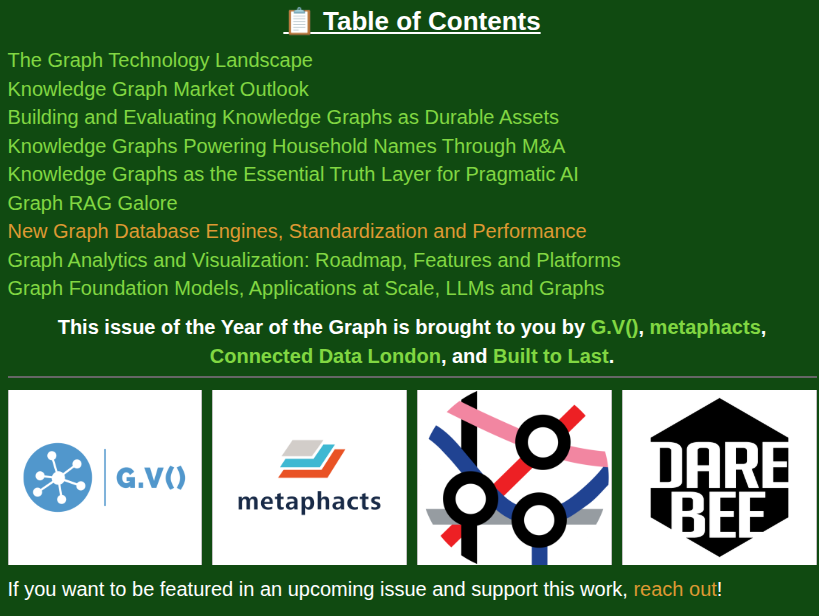
We just started rolling this out with early adopters – G.V(), metaphacts, Connected Data London and Built to Last. So far, so great. Smooth process, great collaboration, near-zero overhead, new revenue stream, off the charts ROI, happy clients.
Initial numbers translate to something between 5 and 2 Euro per click. At worst, this is equal to the best case scenario on other platforms, minus the overhead, and with arguably much better conversion. At best, this beats everything else to the ground. But it gets better.
Year of the Graph Ads have something no other Ad has: SEO and backlink value baked in. Over time, the Year of the Graph has developed a high traffic web site, as well as a wide syndication network. Being included in the newsletter means being published and syndicated, too.
If you’ve ever tried to build your SEO via backlinks, or seen the shady offers to buy junk backlinks for cash, then you’ll appreciate this for what it is: gold.
Keep growing, learning and sharing
Admittedly, it’s too early to declare victory. It’s still a new feature for the Year of the Graph, and new territory for myself. I still like to think of myself as an analyst and writer first and foremost. The rest is only there to serve these primary functions.
But like all things in life, just enough to get by can work, done right and consistently. Pivoting and exploring options is a great way to learn and grow.
As always, you can reach out and share your ideas and comments on the Year of the Graph here.
This is also the place to reach out if you’d like to be featured as a sponsor in an upcoming issue. Next one is coming out on September 22nd.
If you’ve found this interesting for others too, sharing is caring.
If you haven’t subscribed to the Year of the Graph newsletter yet – what are you waiting for?
:::tip
Subscribe to the Year of the Graph Newsletter
:::
Besides all the reasons you know, there’s another one.
We are working on documenting the State of the Graph. This new project will be unveiled soon, and the Year of the Graph subscribers / followers will be the first to know.
Let’s keep growing, learning and sharing.
One last thing before signing off: if you like insights and conversations with leaders and innovators who share their work and ideas, you can subscribe to my personal newsletter and podcast too. The Orchestrate all the Things newsletter and podcast features from the likes of Gary Marcus and Andrew Ng to emerging thinkers and innovators across multiple domains.
:::tip
Subscribe to Orchestrate all the Things
:::
\


You May Also Like

Sterling Weakens As Dollar Soars On Geopolitical Escalation And Bailey’s Cautious Stance

BNB slips below $590 as Trump threatens to strike Iranian power plants


