Solana (SOL) Eyes 30% Surge If Key $90 Support Level Holds Strong
Key Takeaways
- SOL maintains its position in the $89–$90 range as market participants defend critical support.
- Breaking decisively above $90 resistance could propel prices toward $120, representing approximately 30% upside.
- Monthly trading volumes surged 30%, temporarily nearing the $5 billion threshold.
- Network transaction volume declined 20% from recent highs, indicating reduced on-chain activity.
- Technical analyst Crypto Patel identifies a monthly bullish engulfing pattern as the critical indicator for an extended rally.
Solana continues to consolidate near the $90 threshold as market forces clash over this pivotal price zone. The next several sessions will likely determine whether SOL can sustain upward momentum or retreat to lower support areas.
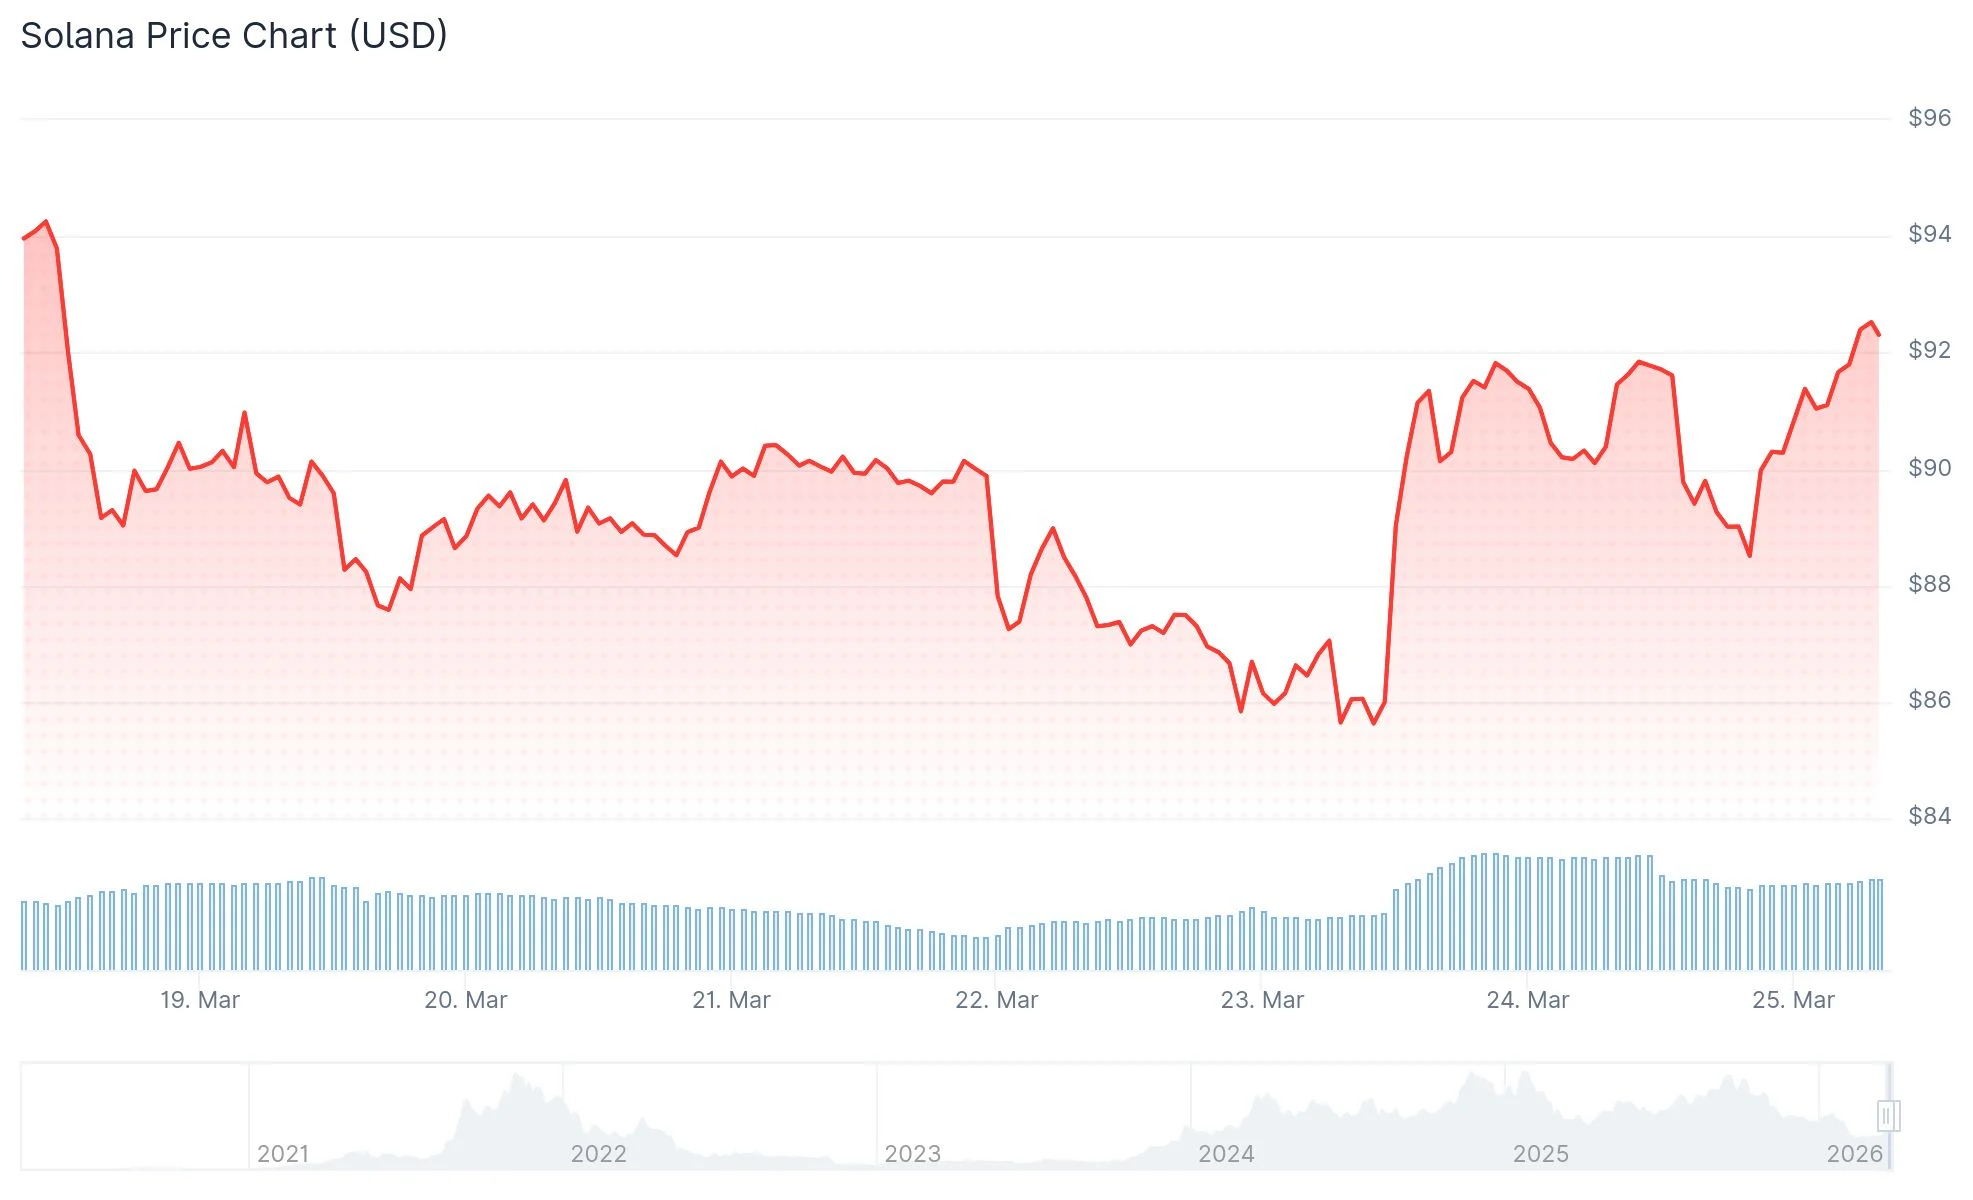 Solana (SOL) Price
SOL has posted gains of approximately 7% throughout the past 30 days and currently trades slightly beneath the $90 resistance barrier. Monthly trading activity expanded by 30%, briefly touching the $5 billion mark, which represents roughly 10% of the token’s total circulating market capitalization.
President Donald Trump’s decision to temporarily halt U.S. military operations against Iranian energy infrastructure provided a boost to cryptocurrency markets early in the week. This development momentarily propelled SOL beyond $90, though persistent selling pressure has prevented sustained movement above this threshold.
Liquidation figures reveal that more than $370 million in bearish positions were eliminated during the recent upward movement. Should buying momentum continue, an even more significant short squeeze scenario could materialize.
Daily chart analysis indicates the Relative Strength Index (RSI) currently registers at 54, following a temporary climb above 60 last week. This positioning suggests building positive momentum that has yet to generate a decisive breakout.
Critical Price Zones Under Observation
A confirmed breach of $90 would establish $100 as the immediate objective, marking an 11% advance. Continued strength beyond that milestone could push prices toward $120, delivering a 30% return from present valuations.
The 4-hour timeframe reveals a buy indication emerged precisely as SOL reached $90, indicating institutional accumulation at this price point. This development reinforces the technical significance of the $90 level.
Conversely, intensifying selling activity could drive SOL down to $85 or potentially $80. The magnitude of any bearish pressure would dictate the depth of a potential retracement.
Network Metrics and Long-Term Technical Pattern
On-chain metrics from Artemis indicate Solana processed 774 million transactions during the previous week. This figure represents a 20% reduction from the latest peak, reflecting diminished network engagement.
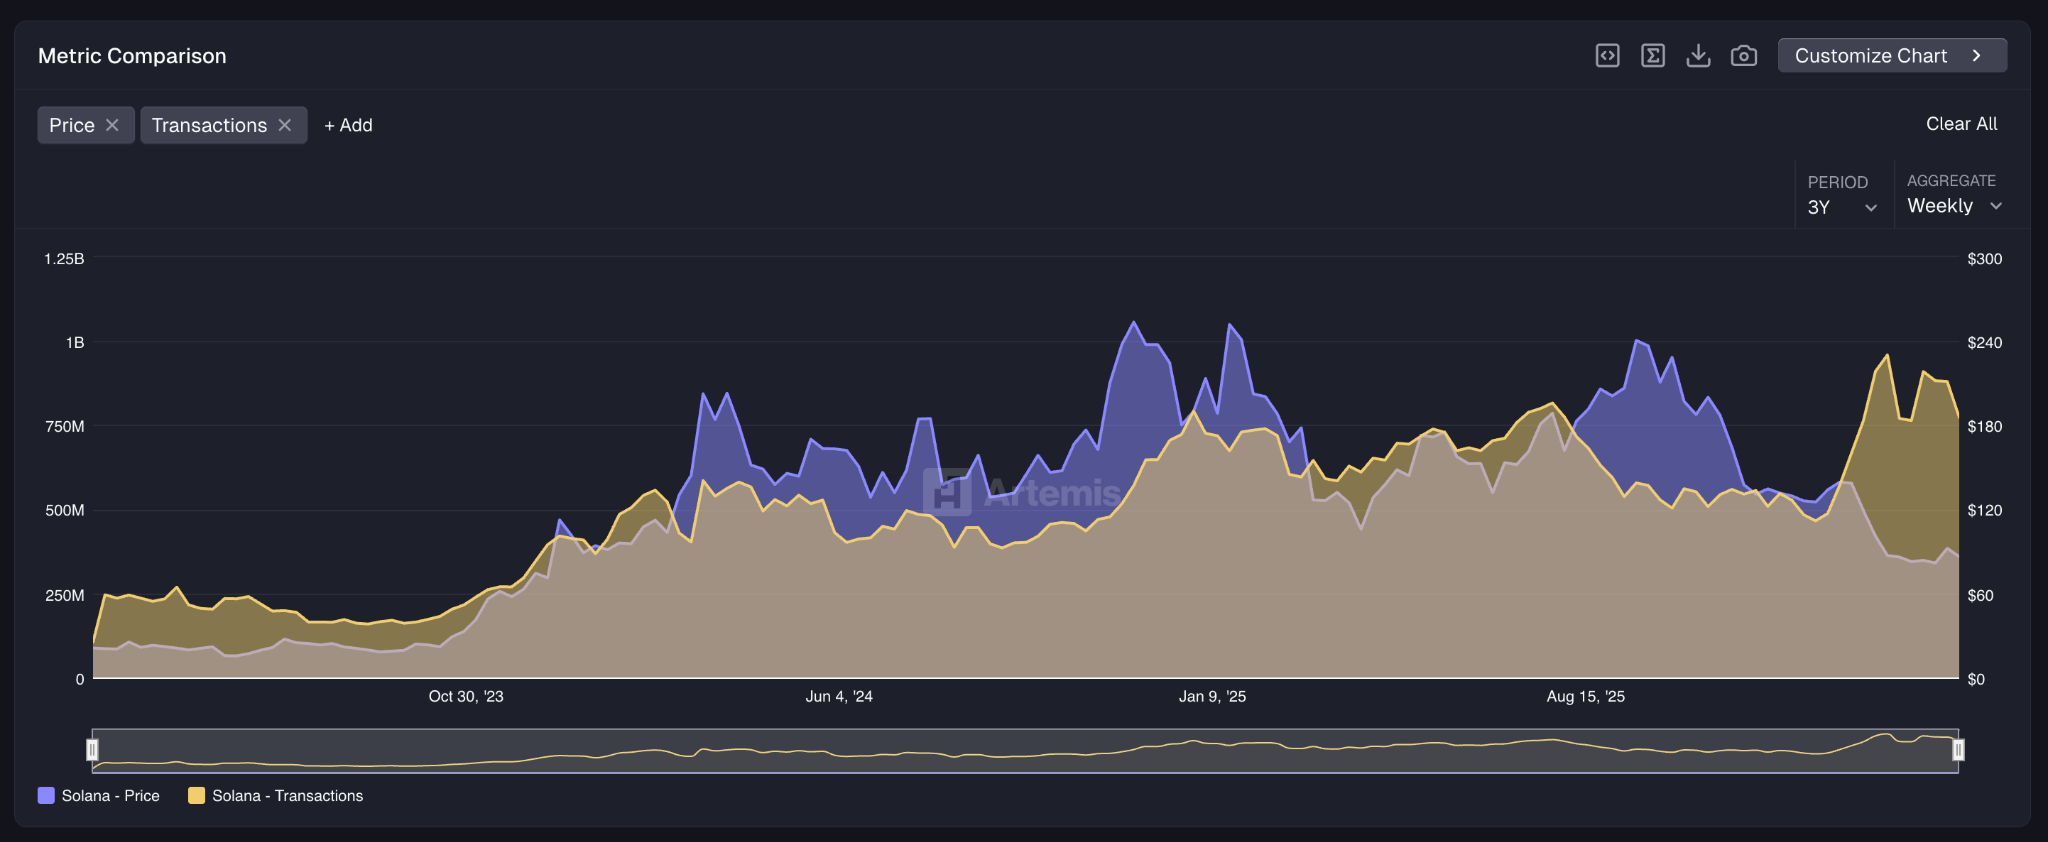 Source: Artemis
The Fear and Greed Index has rebounded from an extreme reading of 5 to 46, demonstrating that investors are exiting panic territory, though overall sentiment remains measured.
Examining the monthly timeframe, analyst Crypto Patel has identified a noteworthy technical formation. His research indicates that every substantial SOL rally has been preceded by a monthly bullish engulfing candle formation.
Historical precedents include Solana‘s spectacular climb from $1.03 to $260 during 2020 and its subsequent surge from $8 to $296 in 2022. Patel suggests a comparable candle formation in 2026 could potentially drive SOL toward $1,000 or higher.
Present technical readings present a divided picture. The monthly RSI stands at 35.44, while SOL trades beneath all significant moving averages, including benchmarks at $104, $111, $152, and $160.
The MACD indicator shows a reading of -1.26, positioned below its signal line at -20.88, accompanied by a negative histogram, implying ongoing near-term downward pressure.
At press time, SOL trades at $89.33, recording $6.95 billion in 24-hour trading volume with a total market capitalization of $51.64 billion.
The post Solana (SOL) Eyes 30% Surge If Key $90 Support Level Holds Strong appeared first on Blockonomi.
You May Also Like

FCA komt in 2026 met aangepaste cryptoregels voor Britse markt

Top 15 AdTech Companies in India: 2026 Full Guide