

SEI Price Signals Reversal as Buyers Step In: $0.07 Next?
The post SEI Price Signals Reversal as Buyers Step In: $0.07 Next? appeared first on Coinpedia Fintech News
SEI price is beginning to show early signs of a reversal, climbed over 10% today, after an extended period of downside pressure. Recent price action highlights a shift in behaviour, with buyers stepping in aggressively near local lows and driving a sharp reaction backed by rising volume.
While the broader trend has yet to fully reverse, the current structure suggests that selling pressure is weakening. With price now testing a key resistance zone, SEI is entering a phase where the next move could be decisive.
On-Chain Activity Strengthens as User Growth and Development Remain Active
Sei’s on-chain data reflects a combination of steady engagement and improving participation. Social volume continues to show periodic spikes, indicating that market attention increases during key price movements. These bursts often align with local reversals, suggesting that participants are reacting at important levels rather than exiting the market.
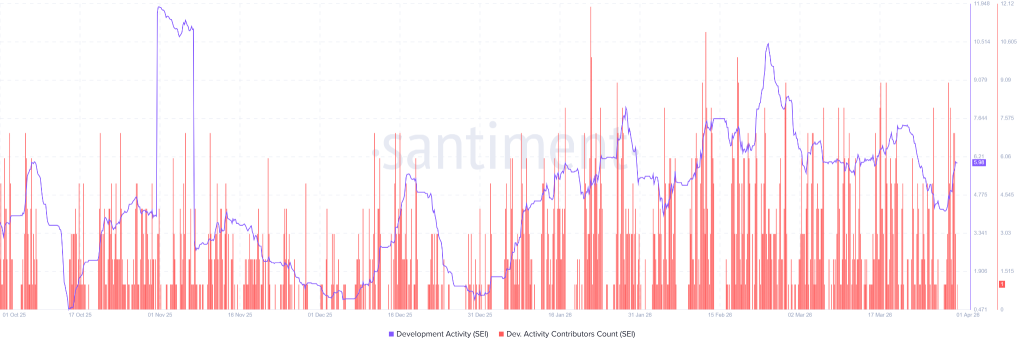
At the same time, development activity remains active, highlighting ongoing ecosystem progress despite recent price weakness. This steady contribution trend suggests that builder activity has not slowed, reinforcing long-term network commitment.
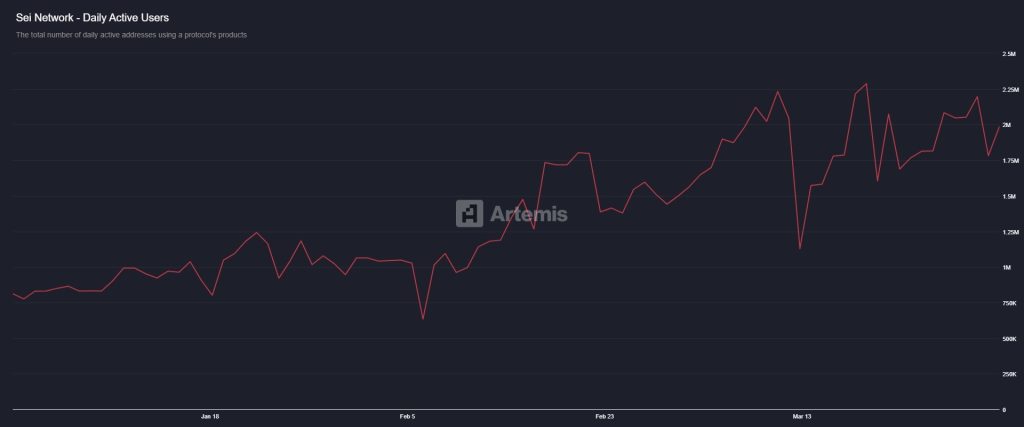
Adding to this, recent data shows a sharp rise in user participation. Daily active addresses have climbed to approximately 1.98 million, marking a 32% increase over the past month. This expansion in activity indicates that network usage is growing even as price attempts to stabilize.
The combination of rising user engagement, consistent development activity, and reactive social interest suggests that underlying demand is strengthening, supporting the case that the current move may be more than a short-term bounce.
SEI Price Structure Shifts After Extended Downtrend
SEI has been trading within a descending channel, forming a consistent pattern of lower highs and lower lows. However, the latest move introduces a change in structure. SEI price has surged over 10% today, rebounded from the lower boundary of the channel with a clear volume spike, indicating that buyers are stepping in with conviction. Instead of continuing lower, the market is now absorbing supply at key levels.
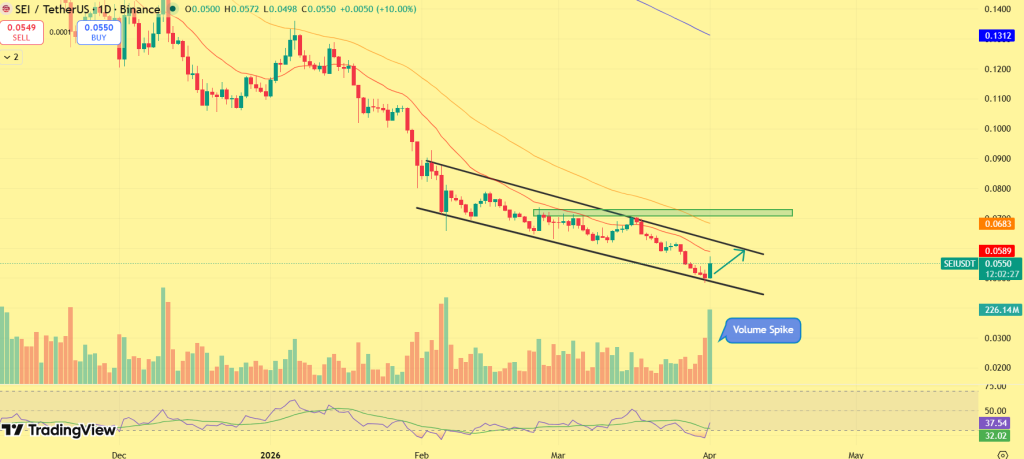
This shift suggests that SEI is transitioning from a strong downtrend into an early-stage stabilization phase. While not yet a confirmed reversal, the structure is beginning to turn.
SEI Tests Breakout Zone Near $0.058–$0.060
SEI is now approaching a critical resistance area that will likely define its next move. The $0.058–$0.060 zone represents a confluence of resistance, aligning with both horizontal supply and the upper boundary of the descending channel. This makes it the key level for confirmation.
A sustained move above this region would signal a structural breakout, opening the path toward $0.068–$0.070, where the next liquidity cluster is positioned. On the downside, failure to reclaim resistance could lead to continued consolidation, with price rotating back toward the $0.050–$0.048 support zone.
What’s Next for SEI
SEI is approaching a key decision point as price tests the $0.058–$0.060 resistance zone. The recent bounce, supported by rising volume and increasing network activity, suggests that buyers are becoming more active at current levels.
A sustained move above this zone would confirm a breakout and open the path toward $0.068–$0.070. However, failure to reclaim resistance could keep SEI within its current range, with price likely rotating back toward the $0.050–$0.048 support zone. The structure is tightening, and the reaction around resistance will define the next move.


You May Also Like

Solana Stablecoin Volume Hits $650B, Price Eyes Key $85 Level

New Hampshire to Issue $100M Bitcoin-Backed Bond With Speculative Moody’s Rating


