Bitcoin (BTC) Price: Analysts Eye One More Drop to $102K Before Bull Market Resumes
TLDR
- Bitcoin analysts predict a potential drop to $104,000 before the bull market can restart, based on historical support patterns at the 50-week simple moving average
- The 50-week SMA currently sits at around $102,500 and has provided support four times since the bull market began in mid-2023
- Large amounts of leverage remain in the market with a major liquidity cluster around $104,000 that traders expect to be tested
- Previous touches of this support level occurred in April 2025 at $74,000 and August 2024 at $49,000, both followed by strong reversals
- Bitcoin currently trades around $108,000 after briefly spiking to $113,000 on Tuesday before pulling back to consolidate at resistance levels
Bitcoin is showing signs of weakness as crypto market analysts watch for one more potential drop. The digital currency may need to flush down to $104,000 before the bull market can properly restart.
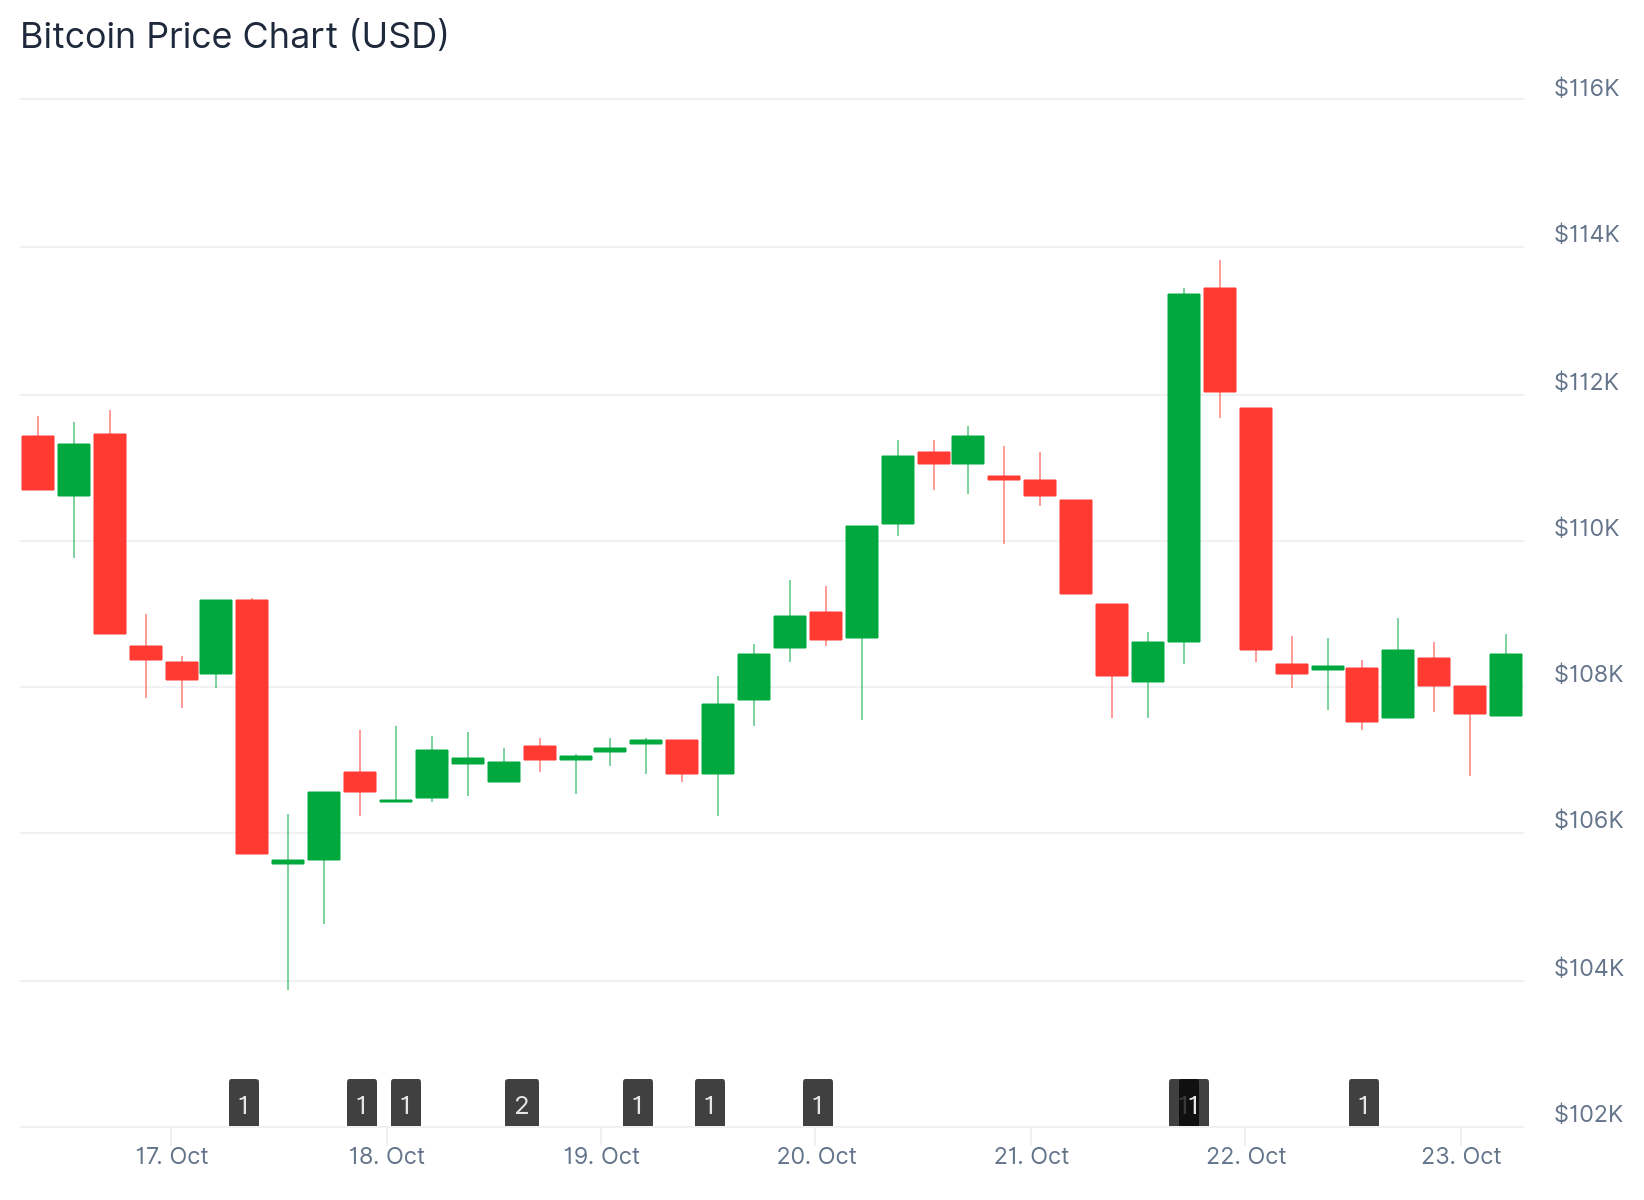 Bitcoin (BTC) Price
The 50-week simple moving average stands at around $102,500 right now. This technical indicator has provided strong support four times since the bull market started in mid-2023.
Analysts believe Bitcoin will likely revisit this level again soon. The market still holds large amounts of leverage. A major liquidity cluster sits around $104,000.
Analyst Sykodelic noted on Thursday that the market will probably take out this level. “I know its not what any holder wants to hear, but very likely we take that out,” the analyst said.
The analyst pointed out that markets usually feel worst right before they reverse. This pattern has played out twice already during this cycle.
In April 2025, Bitcoin dropped to $74,000 when it touched the 50-week SMA. In August 2024, it crashed to $49,000 at the same indicator. Both times, negative sentiment was extremely high. Both times, Bitcoin reversed strongly after hitting that support level.
Current Market Setup Points Lower
Other market watchers share this view. Analyst Negentropic stated this would be the final flush. “We are seeing a repeat of the final phases of correction in September, it seems like the profit taking this time around is less intensive,” the analyst said.
The current setup opens the door to $102,000. Analysts believe the market is very close to a larger reversal now.
Analyst Daan Crypto Trades identified the 200-day exponential moving average as a key support area during most of this cycle. Price has experienced some volatility around this level during uncertain times. But the trend has never been lost for more than a month.
Price Action and Key Levels
Bitcoin has stayed relatively stable over the past 24 hours. The cryptocurrency hovers around the $108,000 level. This price point represents a key support-turned-resistance zone.
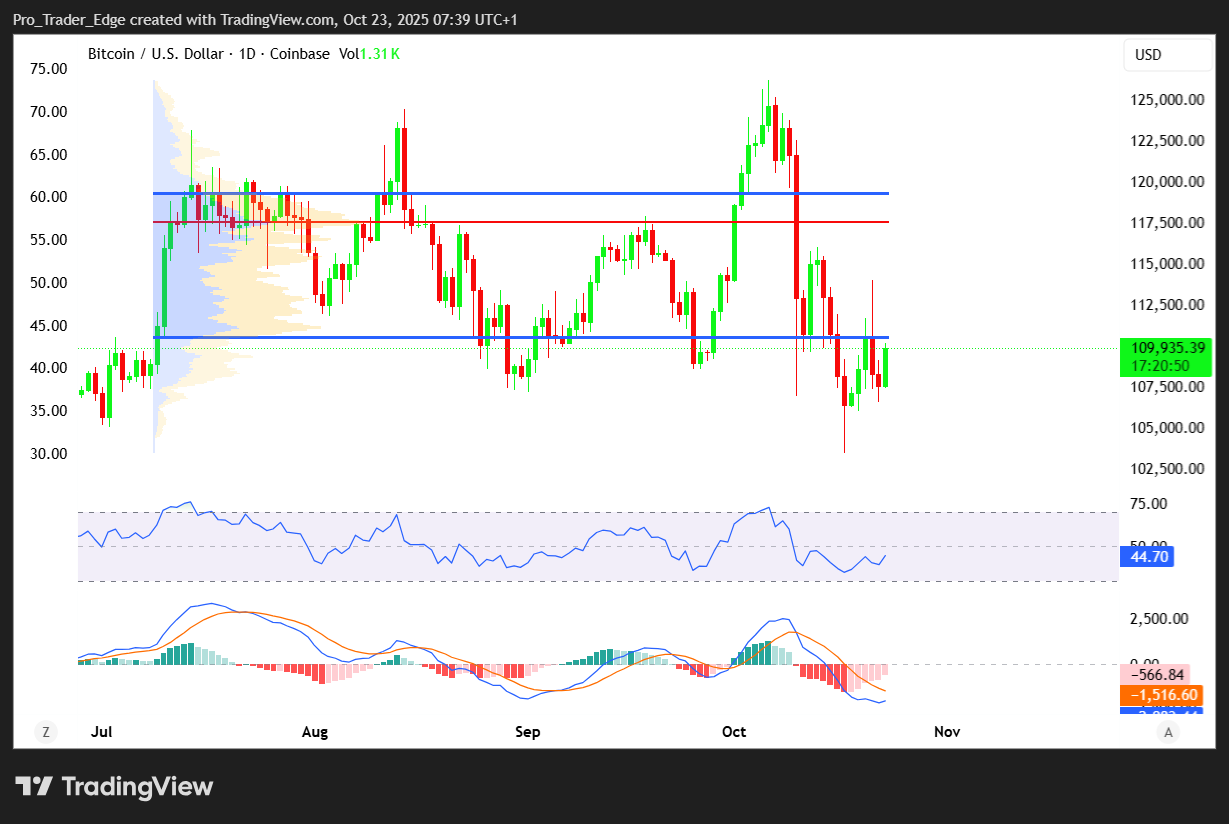 Source: TradingView
On Tuesday, Bitcoin briefly spiked to $113,000. It quickly fell back to $107,000 before settling at the current resistance level. The price has started to consolidate at this point.
Bitcoin is now trading below $109,000 and the 100-hour simple moving average. A short-term declining channel is forming with resistance at $108,800.
The price attempted to recover above $107,500 and $108,000. Bitcoin tested the $106,750 zone recently. A low was formed at $106,717 before the price recovered some losses.
The bulls now face many hurdles. Immediate resistance on the upside sits near the $108,800 level. The first key resistance is near $109,500.
The next resistance could be $110,500. A close above this level might send the price higher. Bitcoin could potentially test $111,500 and $112,000 in that scenario.
If Bitcoin fails to rise above $109,500, it could start another decline. Immediate support is near $107,200. The first major support sits at $106,750. The next support level is near $105,800. Further losses might send the price toward $105,000 support. The main support sits at $103,500.
The post Bitcoin (BTC) Price: Analysts Eye One More Drop to $102K Before Bull Market Resumes appeared first on CoinCentral.
You May Also Like
XRPL Validator Reveals Why He Just Vetoed New Amendment

MAXI DOGE Holders Diversify into $GGs for Fast-Growth 2025 Crypto Presale Opportunities