

Crypto Market Fear Analysis: When Sentiment Diverges from Price Movement

Key Takeaways
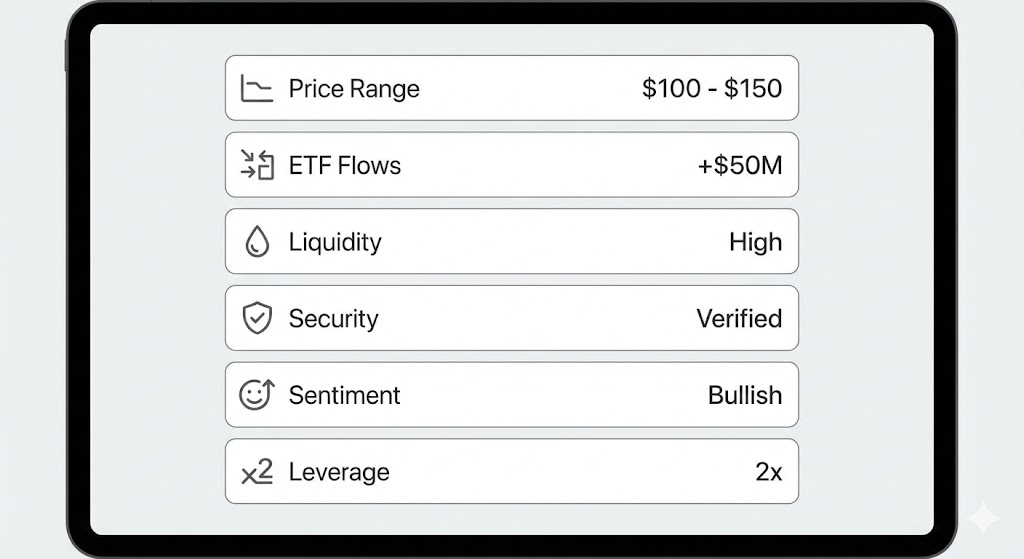
- The Disconnect: In late December 2025, sentiment reached "Extreme Fear" (20/100), yet BTC and ETH held their structural support, correcting only 3-5% from recent highs.
- Headline Fatigue: Reports of net outflows from Spot ETFs amplified bearish sentiment, overshadowing the resilience of spot prices.
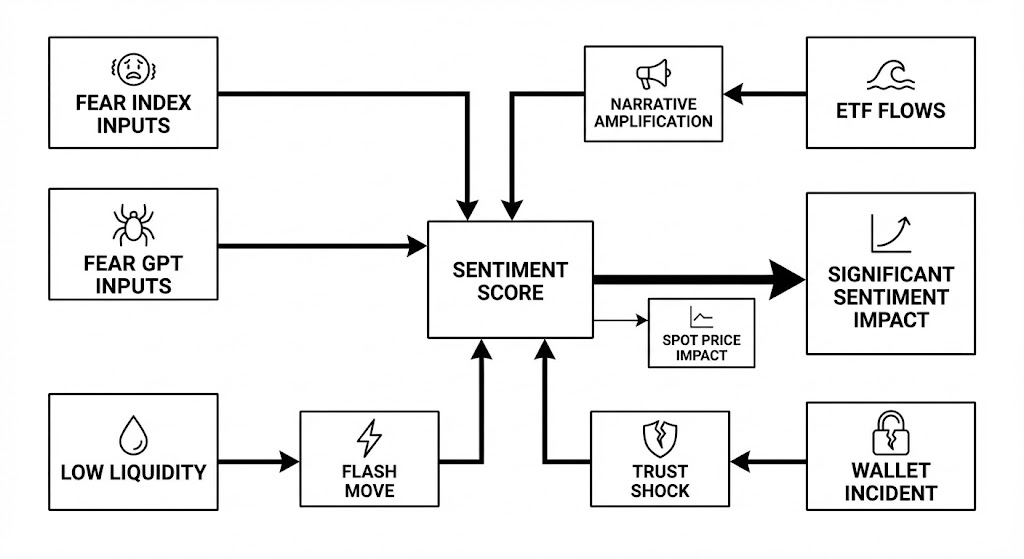
- Liquidity Factors: A flash move on an external trading venue, combined with the Trust Wallet security incident, triggered a "micro-panic" during low-liquidity holiday hours.
- 2026 Lesson: Investors must differentiate between psychological stress (headlines) and structural stress (broken trends).
Fear Gauge vs. Market Reality
- BTC Price Drawdown: Bitcoin traded approximately 3-4% below its weekly high.
- ETH Price Drawdown: Ethereum traded roughly 3-5% below its weekly high.
What Triggered the Fear? (December 2025 Analysis)
1. The ETF Outflow Narrative
2. Isolated Flash Moves
- The Event: A rapid downward wick on a single pair that swiftly recovered.
- The Reality: This represented a microstructural anomaly confined to a single venue. Nevertheless, screenshots of the "crash" circulated widely, generating artificial panic.
3. The Trust Wallet Incident
FAQ: Applying These Insights in 2026
Why did the Fear Index remain low despite BTC's stability?
How should I respond to ETF outflows this year?
Did the flash move indicate market dysfunction?
Disclaimer:
המאמרים הפופולריים

זהב חוזר ל-5,000$: למה הפאניקה של וורש נכשלה והקוואנטים קנו
המחסום הפסיכולוגי של 5,000$ לאונקיה נפל שוב. אבל הפעם, ההתאושות מספרת סיפור הרבה יותר משמעותי מאשר הפריצה הראשונית. על פי נתוני שוק MEXC, זהב ספוט (XAU) חזר בצורת V מעל רף ה-5,000$, כאשר כסף (XAG) רשם
למה הקריפטו יורד? זה לא FUD, זה סיבוב נכסים קשים וריק נזילות לפני CNY
אם אתה מחפש כותרת חדשות ספציפית שתסביר את הנרות האדומים של היום, תפסיק לחפש. אין כזו.סוחרי קמעונאות כרגע סורקים את טוויטר אחר "FUD" (פחד, אי-ודאות, ספק) כדי להאשים בירידה. אבל אם אתה יושב בשולחן מסחר
למה כסף חכם סוחר חוזים עתידיים על נחושת (XCU) ב-MEXC
כאשר משקיעים חושבים על נחושת, הם לעתים קרובות חושבים על מטילי מתכת פיזיים או קרנות סל איטיות. כך "העולם הישן" סוחר.אבל עבור הסוחר הקריפטו המודרני ב-MEXC, השקת החוזים העתידיים התמידיים של COPPER (XCU)
מהו Rayls (RLS)? מבוא מקיף לבלוקצ'יין עבור בנקים
נקודות מפתח1) Rayls היא בלוקצ'יין שנבנה במיוחד עבור בנקים ומוסדות פיננסיים, המאפשר שירותים פיננסיים על-שרשרת תואמים, פרטיים וניתנים להרחבה.2) היא מאחדת TradFi ו-DeFi על ידי שילוב שרשרת EVM ציבורית עם
מאמרים קשורים
Sentient Crypto Airdrop Guide: Complete SENT Token Claim Process and Eligibility Check
1. Sentient Airdrop Is Live: SENT Token Claim Timeline and Methods ExplainedSentient, a pioneering project focused on open Artificial General Intelligence (AGI) development, has officially launched it
MEXC Referral Ambassador Program Complete Guide: Upgrade Your Level and Earn High Rewards with Passive Income
The MEXC Referral Ambassador Program provides a long-term, community-driven incentive system for all users. This guide explains the program structure, upgrade rules, reward distribution, and major adv

Solana Phone 2 Seeker Airdrop Guide: How to Claim SKR Token Complete Tutorial
1. SKR Token Airdrop Now Live: Essential Information for Seeker UsersSolana Mobile has officially announced that the highly anticipated SKR Token airdrop will open for claiming on January 21, 2026, at
StableChain (STABLE) Market Analysis: On-Chain Data vs. Growth Potential
Key TakeawaysInnovation: StableChain eliminates the need for volatile assets like ETH or SOL by using USDT as its native gas token for transaction fees.Bearish Signal: Despite a high-profile December
