

Ethereum (ETH) Market Split: Bearish MACD or Incoming Bull Flag Rally?
Ethereum is showing mixed signals on the charts, with analysts watching key technical levels and momentum indicators.
While downside risks have emerged, other signals suggest possible support near current prices. The asset remains above $3,900, a level that several traders are monitoring as a key zone.
Bearish Momentum Builds on Weekly MACD
Ali Martinez noted that Ethereum is close to a bearish MACD crossover on the weekly timeframe, a pattern that has led to steep price drops in past cycles. The last two times this signal appeared, ETH fell by 43% and 61%. The MACD histogram is also turning lower, pointing to fading momentum.
Ethereum is trading near $4,000 at press time, down 4% over the past day and 10% on the week. The crossover has not yet been confirmed. If the signal completes, some expect a stronger correction to follow.
RSI Oversold and Flag Pattern Still Active
Tom Tucker noted Ethereum’s RSI is sitting at around 16, a level considered deeply oversold. He said, “RSI at 16.25 = heavily oversold territory,” adding that rebounds often follow similar readings. Tucker also noted that bearish signals might be drawing in sellers too early.
Titan of Crypto shared a chart showing a bull flag pattern on Ethereum’s weekly chart. The flag follows a sharp rally and is still intact. If the breakout occurs, the pattern points to a move toward $6,700. This is based on the height of the flagpole added to the breakout point.
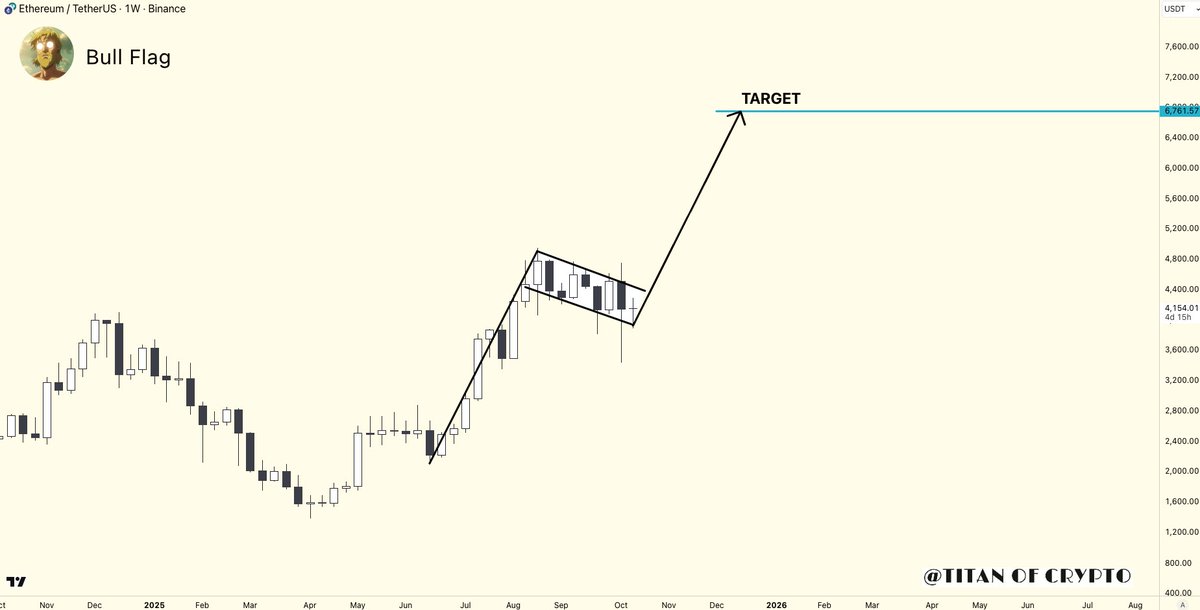 Source: Titan of Crypto/X
Moreover, Martinez also highlighted MVRV Pricing Bands, which track historical deviation from Ethereum’s realized price. ETH is holding above the mean band at $3,900, marking it as a support area.
If this area holds, the upper pricing bands suggest upside toward $5,000 and $6,000. If it fails, traders may look toward lower zones near $2,800.
Institutional Demand and Blockchain Use Expanding
Bitwise reported that 95% of ETH held by public companies was bought in the last quarter. A total of 4.4 million ETH was added, a 1,937% rise compared to the previous quarter. Combined holdings by public firms and ETFs now stand at 12.50 million ETH, or 10.31% of the total supply.
Cipher X said Ethereum is becoming the settlement layer of the digital economy. USDC supply is nearing $45 billion, while BlackRock’s BUIDL fund now holds over $2 billion in tokenized US Treasuries. Cipher said both are “growing side by side” without coordination, powered by market use of Ethereum’s infrastructure.
The post Ethereum (ETH) Market Split: Bearish MACD or Incoming Bull Flag Rally? appeared first on CryptoPotato.


추천 콘텐츠
![[Rear View] Make your daddy proud](https://www.rappler.com/tachyon/2026/04/rapplers-best-jumping-jacks-April-20-2026.jpg?resize=75%2C75&crop=252px%2C0px%2C720px%2C720px)
[Rear View] Make your daddy proud

Trump torn apart for military purge following Pentagon power struggle


