

Bitcoin Drops Below $83,000 as Bearish Sentiment Deepens

Highlights:
- The Bitcoin price is hovering around $82,000 amid intensified bearish momentum.
- The US employment report has revealed an increase in US payroll of 119,000, and the unemployment rate rose to 4.4%.
- The technical outlook shows potential for further losses, as the bears take control.
The Bitcoin price has led the market-wide sell-off, plunging 9% to $82,670 over the last 24 hours. Meanwhile, its daily trading volume has soared 47% to $124 billion, indicating intense market activity. Bitcoin has dropped to its lowest since April. This is due to conflicting US labor statistics, which have dashed the hopes of a rate cut by the Federal Reserve next month. This recent news could be the catalyst for a selling wave in the cryptocurrency market.
The US jobs report recorded an increase of 119,000 payrolls and a rise in the employment rate to 4.4%. This has left the CME Group FedWatch Tool with just 41% probability of a rate cut in the coming month.
Meanwhile, when the Bitcoin price hit the $124,000 mark, the momentum of the bulls started to slow down. There were frequent rejections, which indicated exhaustion and eventually led to an extreme turnaround of the cycle.
Bitcoin Price Under Pressure as Bears Dominate
The bears appear to have, however, assumed control of the price after the breakdown took off pace as BTC has dropped beneath the 200-day ($110,311) and 50-day ($107,618) Simple Moving Average (SMA).
The 50-day SMA has been an important trend indicator in the past, and its loss typically marks the beginning of further correction. Several unsuccessful attempts to recover at this level further demonstrate the weakening effect, strengthening the bearish sentiment in the BTC market.
With the increased selling, the Bitcoin price has fallen below the descending parallel channel. The altcoin is currently sliding towards the next significant area of demand, located between the ranges of $81,000 and $70,000. This area is one of the previous consolidation zones, and it also coincides with historical support during the early phases of the rally. These may be crucial areas in which the market can stabilize.
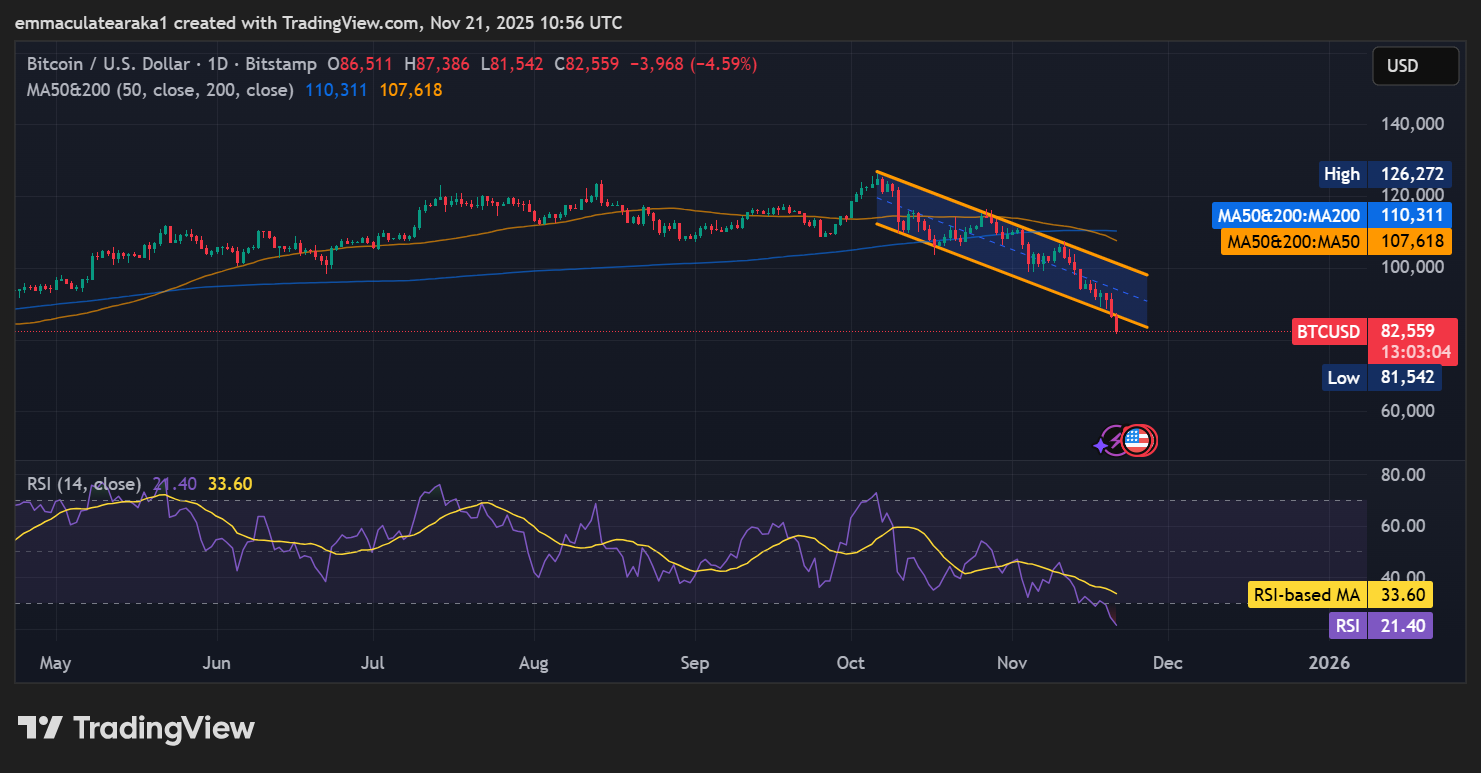 BTC/USD 1-day chart: TradingView
The Relative Strength Index (RSI) has also fallen drastically to 21.40, indicating an oversold condition. This means that the bears are in full control of the BTC market, which may see the price further decline if the bulls don’t regain momentum.
BTC Price Outlook
According to the latest BTC/USD daily chart, the bears are still in power because Bitcoin price is trading decisively under the 50-day and 200-day SMA. Reinforcing the bearish grip is that the altcoin is heading to the significant demand area under 81,000. The overall negative trend is supported by a significant reduction in the RSI.
In the event of bearish pressure, the Bitcoin price may move to explore the support levels between $81,000 and $70,000, where buyers might attempt to reassert their grip. A failure at this level would pave the way to a further correction into the $65,000 safety net. Conversely, with the oversold RSI, the bulls may stage a buy-back campaign, staking a temporary relief bounce. The recovery efforts may face backlash around the $95,000 to $100,000 level.
eToro Platform
Best Crypto Exchange
- Over 90 top cryptos to trade
- Regulated by top-tier entities
- User-friendly trading app
- 30+ million users
eToro is a multi-asset investment platform. The value of your investments may go up or down. Your capital is at risk. Don’t invest unless you’re prepared to lose all the money you invest. This is a high-risk investment, and you should not expect to be protected if something goes wrong.


추천 콘텐츠

Trump nearly spills state secrets during rambling movie pitch: report

Solana (SOL) Foundation Launches STRIDE Security Program With 24/7 Threat Monitoring


