A divergence has formed in the crypto futures market during the past week as Bitcoin and Solana have seen deleveraging against the others. Bitcoin, Solana Have Seen A Drop In Perpetual Futures Open Interest In a new post on X, on-chain analytics firm Glassnode has talked about the latest trend in the Open Interest for […]A divergence has formed in the crypto futures market during the past week as Bitcoin and Solana have seen deleveraging against the others. Bitcoin, Solana Have Seen A Drop In Perpetual Futures Open Interest In a new post on X, on-chain analytics firm Glassnode has talked about the latest trend in the Open Interest for […]

Crypto OI Shows Mixed Trend: Bitcoin, Solana Down, While Ethereum, XRP Up

A divergence has formed in the crypto futures market during the past week as Bitcoin and Solana have seen deleveraging against the others.

Bitcoin, Solana Have Seen A Drop In Perpetual Futures Open Interest

In a new post on X, on-chain analytics firm Glassnode has talked about the latest trend in the Open Interest for Bitcoin and other top coins in the cryptocurrency sector.

The “Open Interest” here refers to an indicator that measures the total amount of perpetual futures positions related to a given asset that are currently open on all centralized derivatives exchanges.

When the value of this metric goes up, it means the investors are opening up fresh positions on the perpetual futures market. Generally, the total leverage present in the sector rises when this trend develops, so the asset’s price can become more unstable following it.

On the other hand, the indicator registering a decline implies holders are either closing up positions of their own volition or getting forcibly liquidated by their platform. Such a trend usually leads to a reduction in leverage, which can make the price act in a more stable manner.

Now, first, here’s a chart that shows the trend in the Open Interest for Bitcoin over the past week:

Bitcoin Open Interest

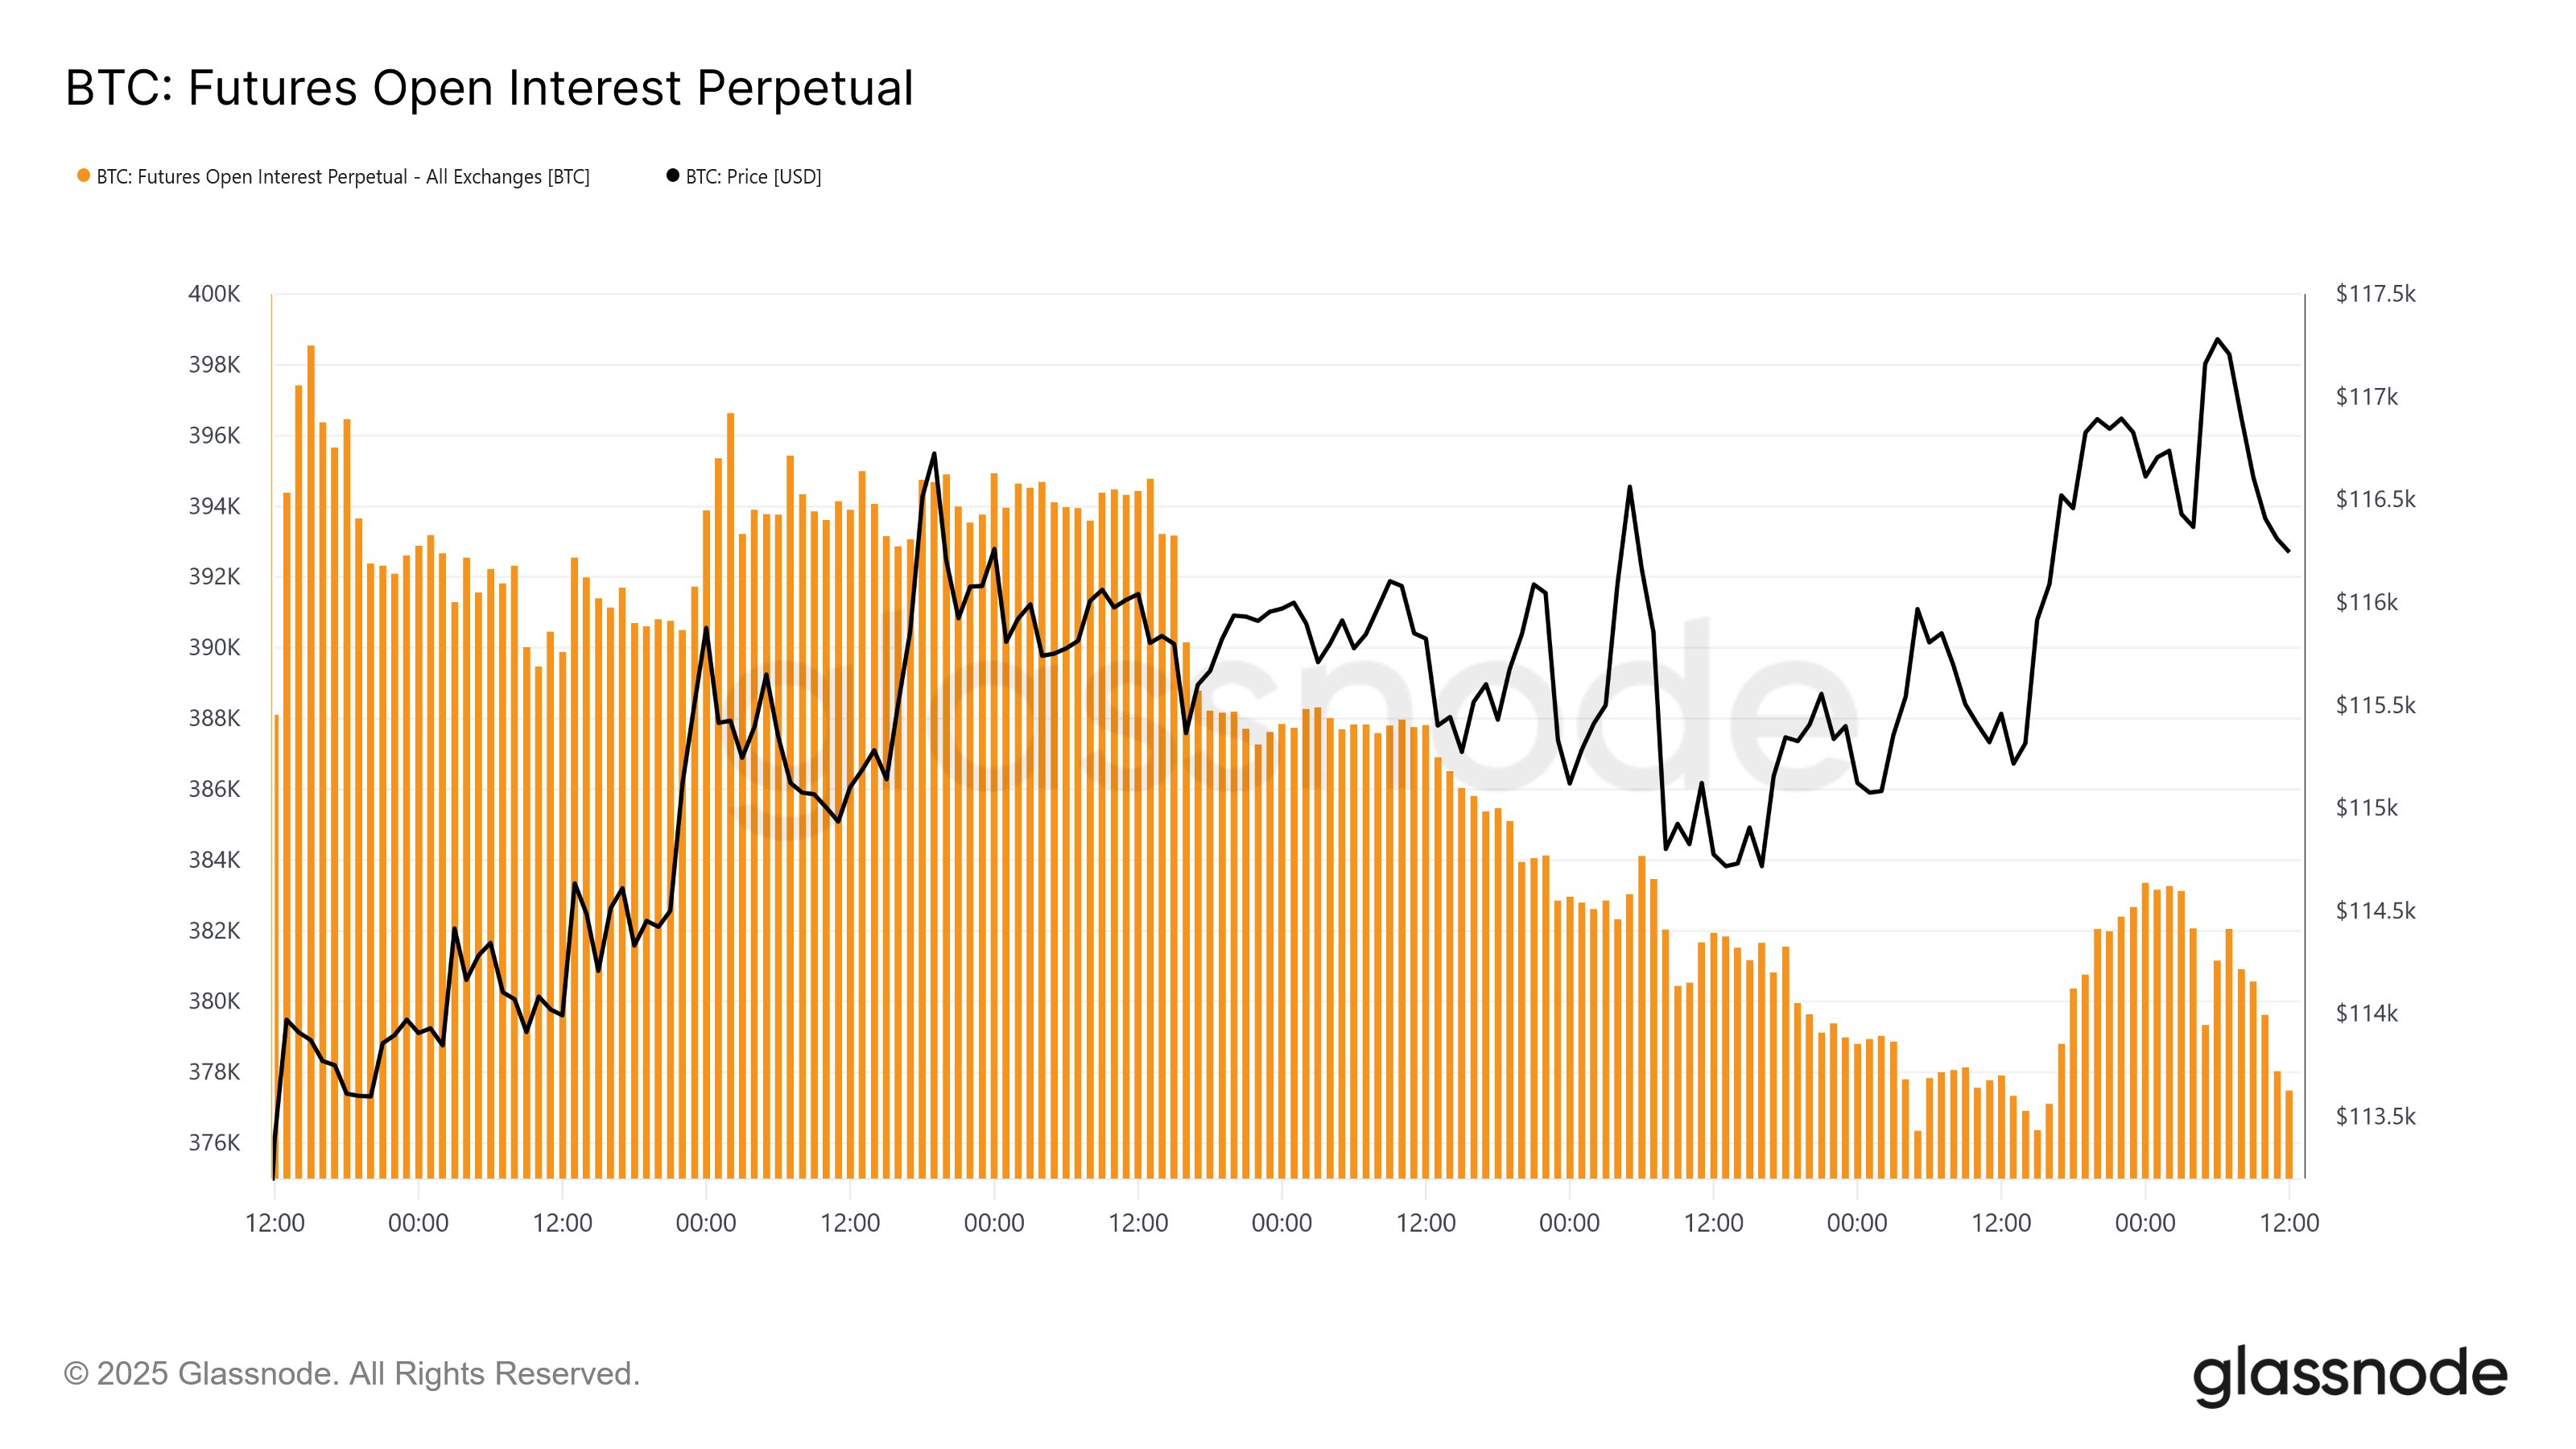
As displayed in the above graph, the Bitcoin Open Interest has followed an overall downward trajectory in this period, a sign that a net amount of positions have disappeared.

Interestingly, this trend has developed alongside a recovery surge in the BTC price to the $117,000 level. Generally, rallies attract speculative activity so the indicator tends to rise with them, but it would appear that it hasn’t been the case this time around.

Solana, the cryptocurrency sixth largest by market cap, has seen a similar trajectory in its Open interest during the past week, as the below chart shows.

Solana Open Interest

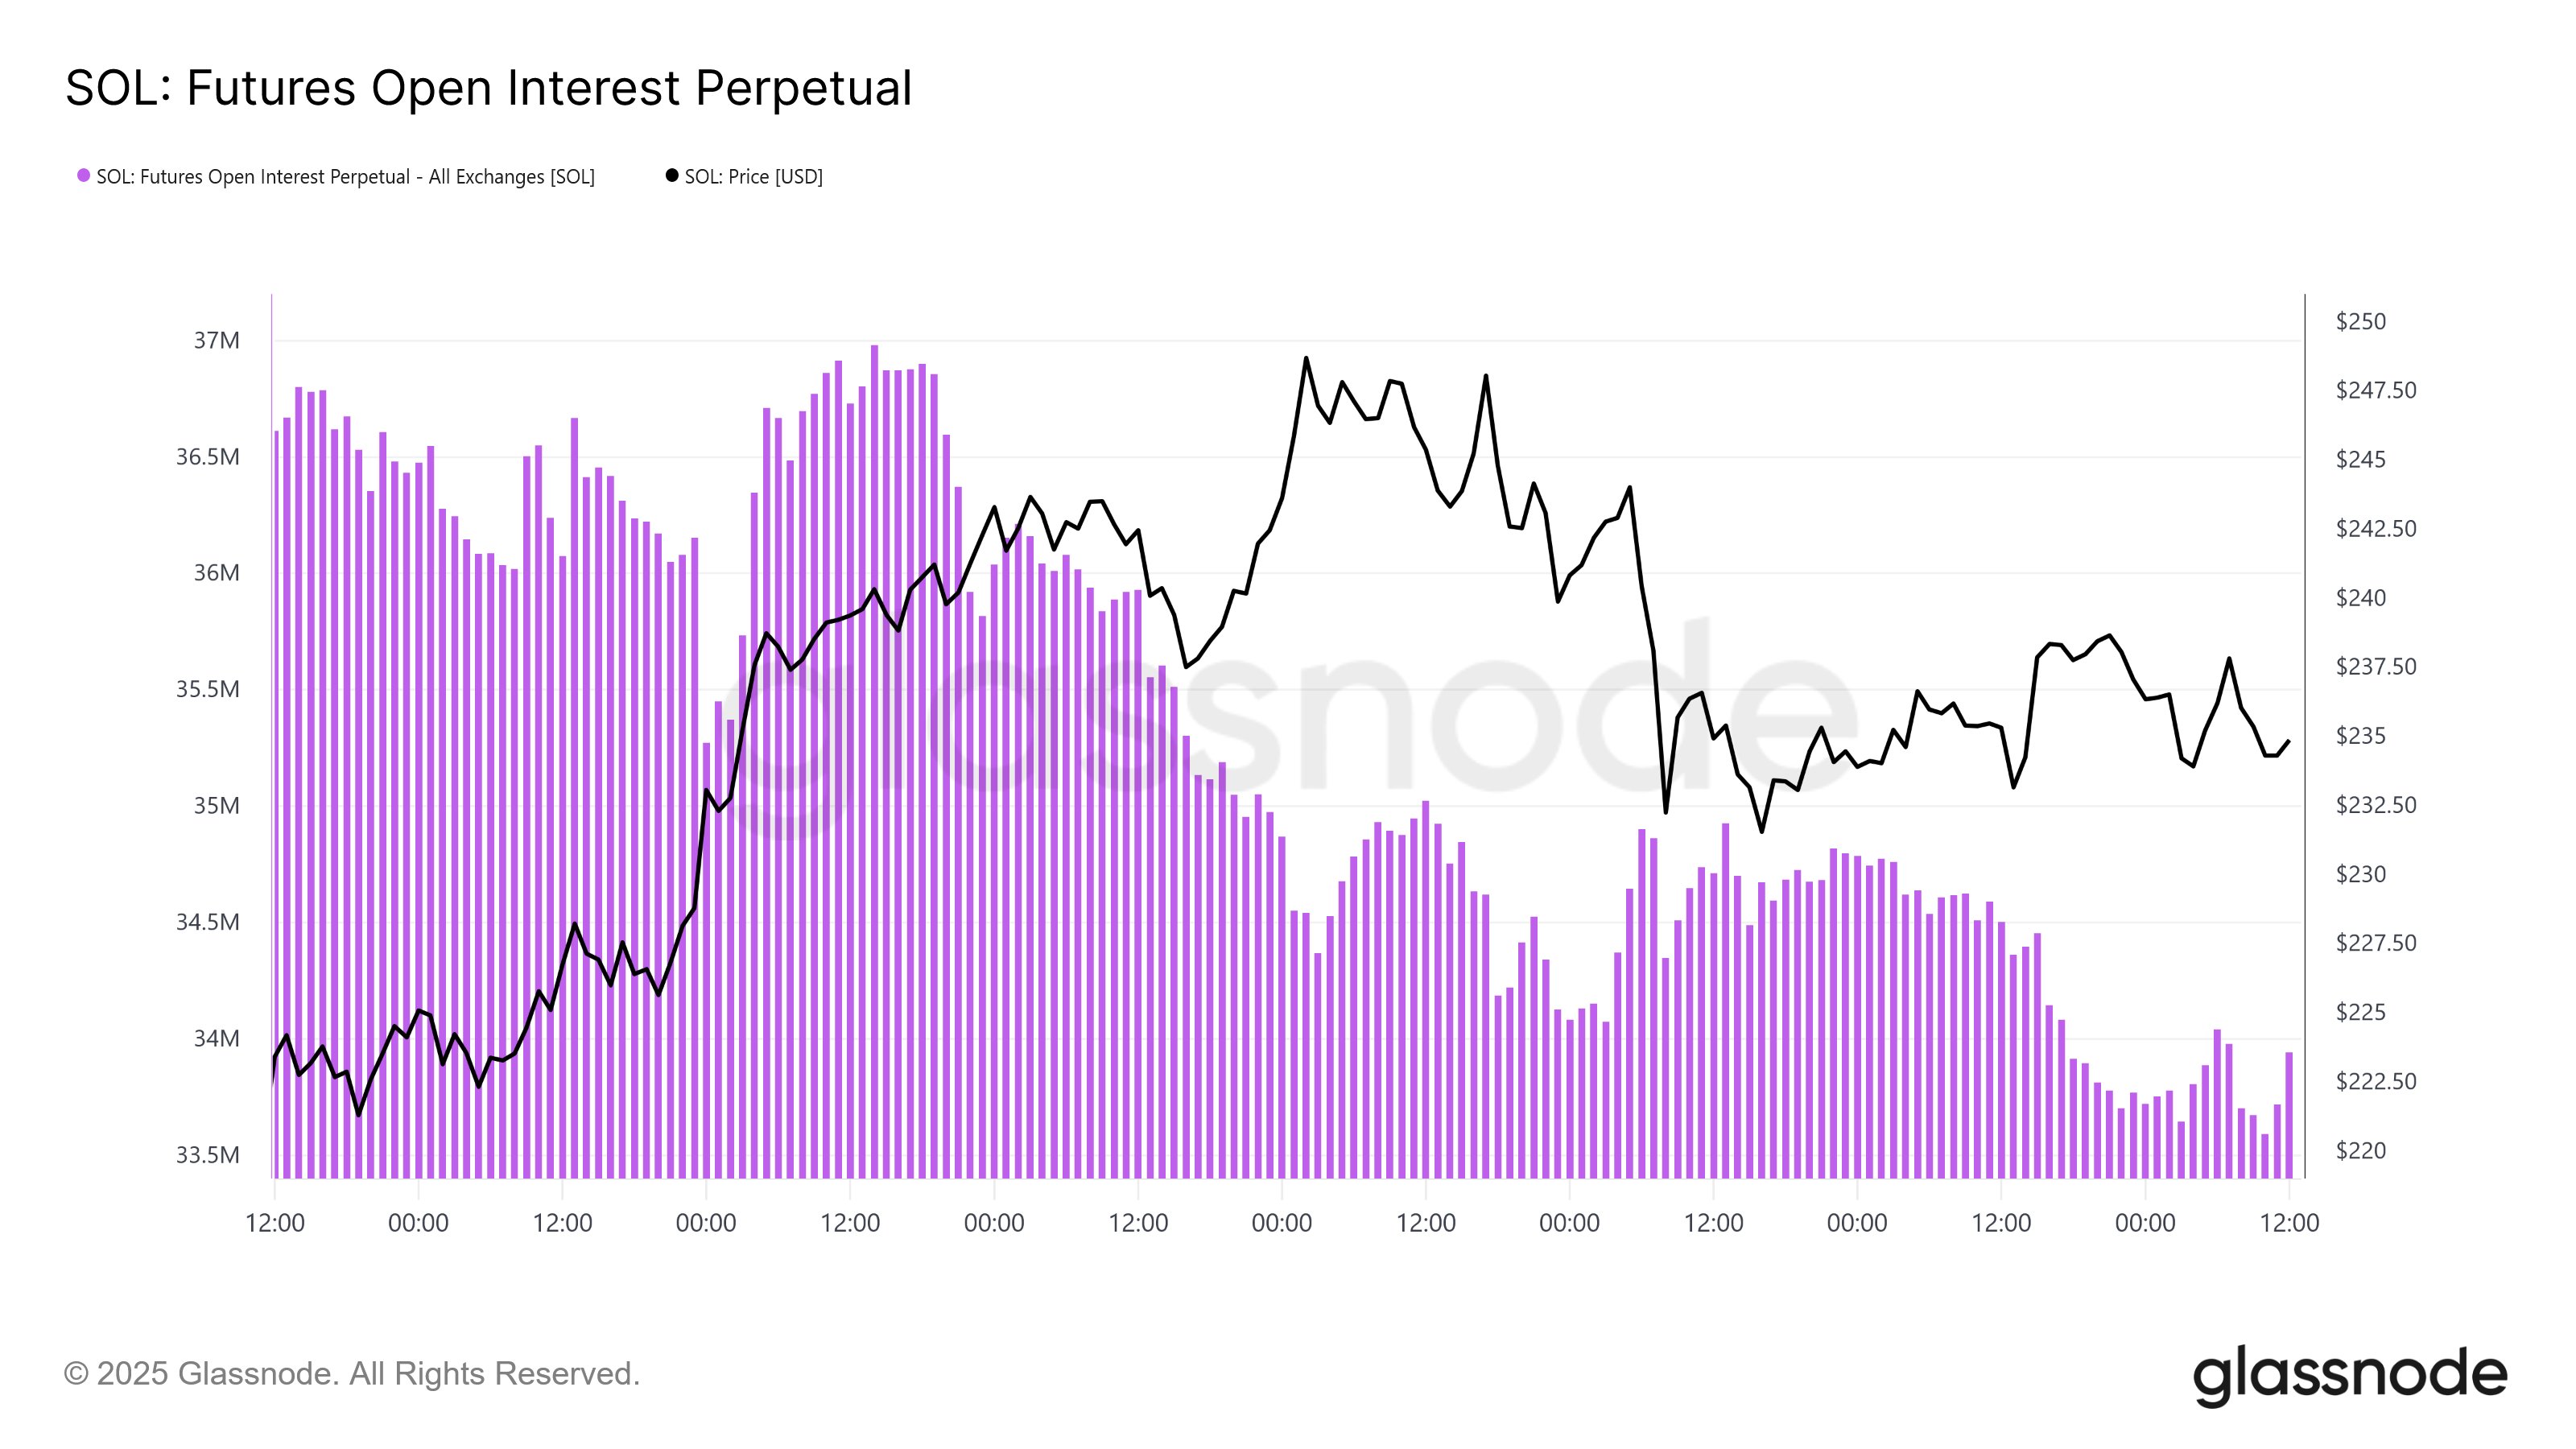
Thus, it seems both BTC and SOL have seen a cooldown in speculative activity even though their prices have witnessed a net increase over the past week. The same trend, however, hasn’t been seen with some of the other top digital assets.

The cryptocurrency number two only to Bitcoin, Ethereum, has witnessed a surge in the Open Interest, implying an increase in demand among the investors for leveraged positioning.

Ethereum Open Interest

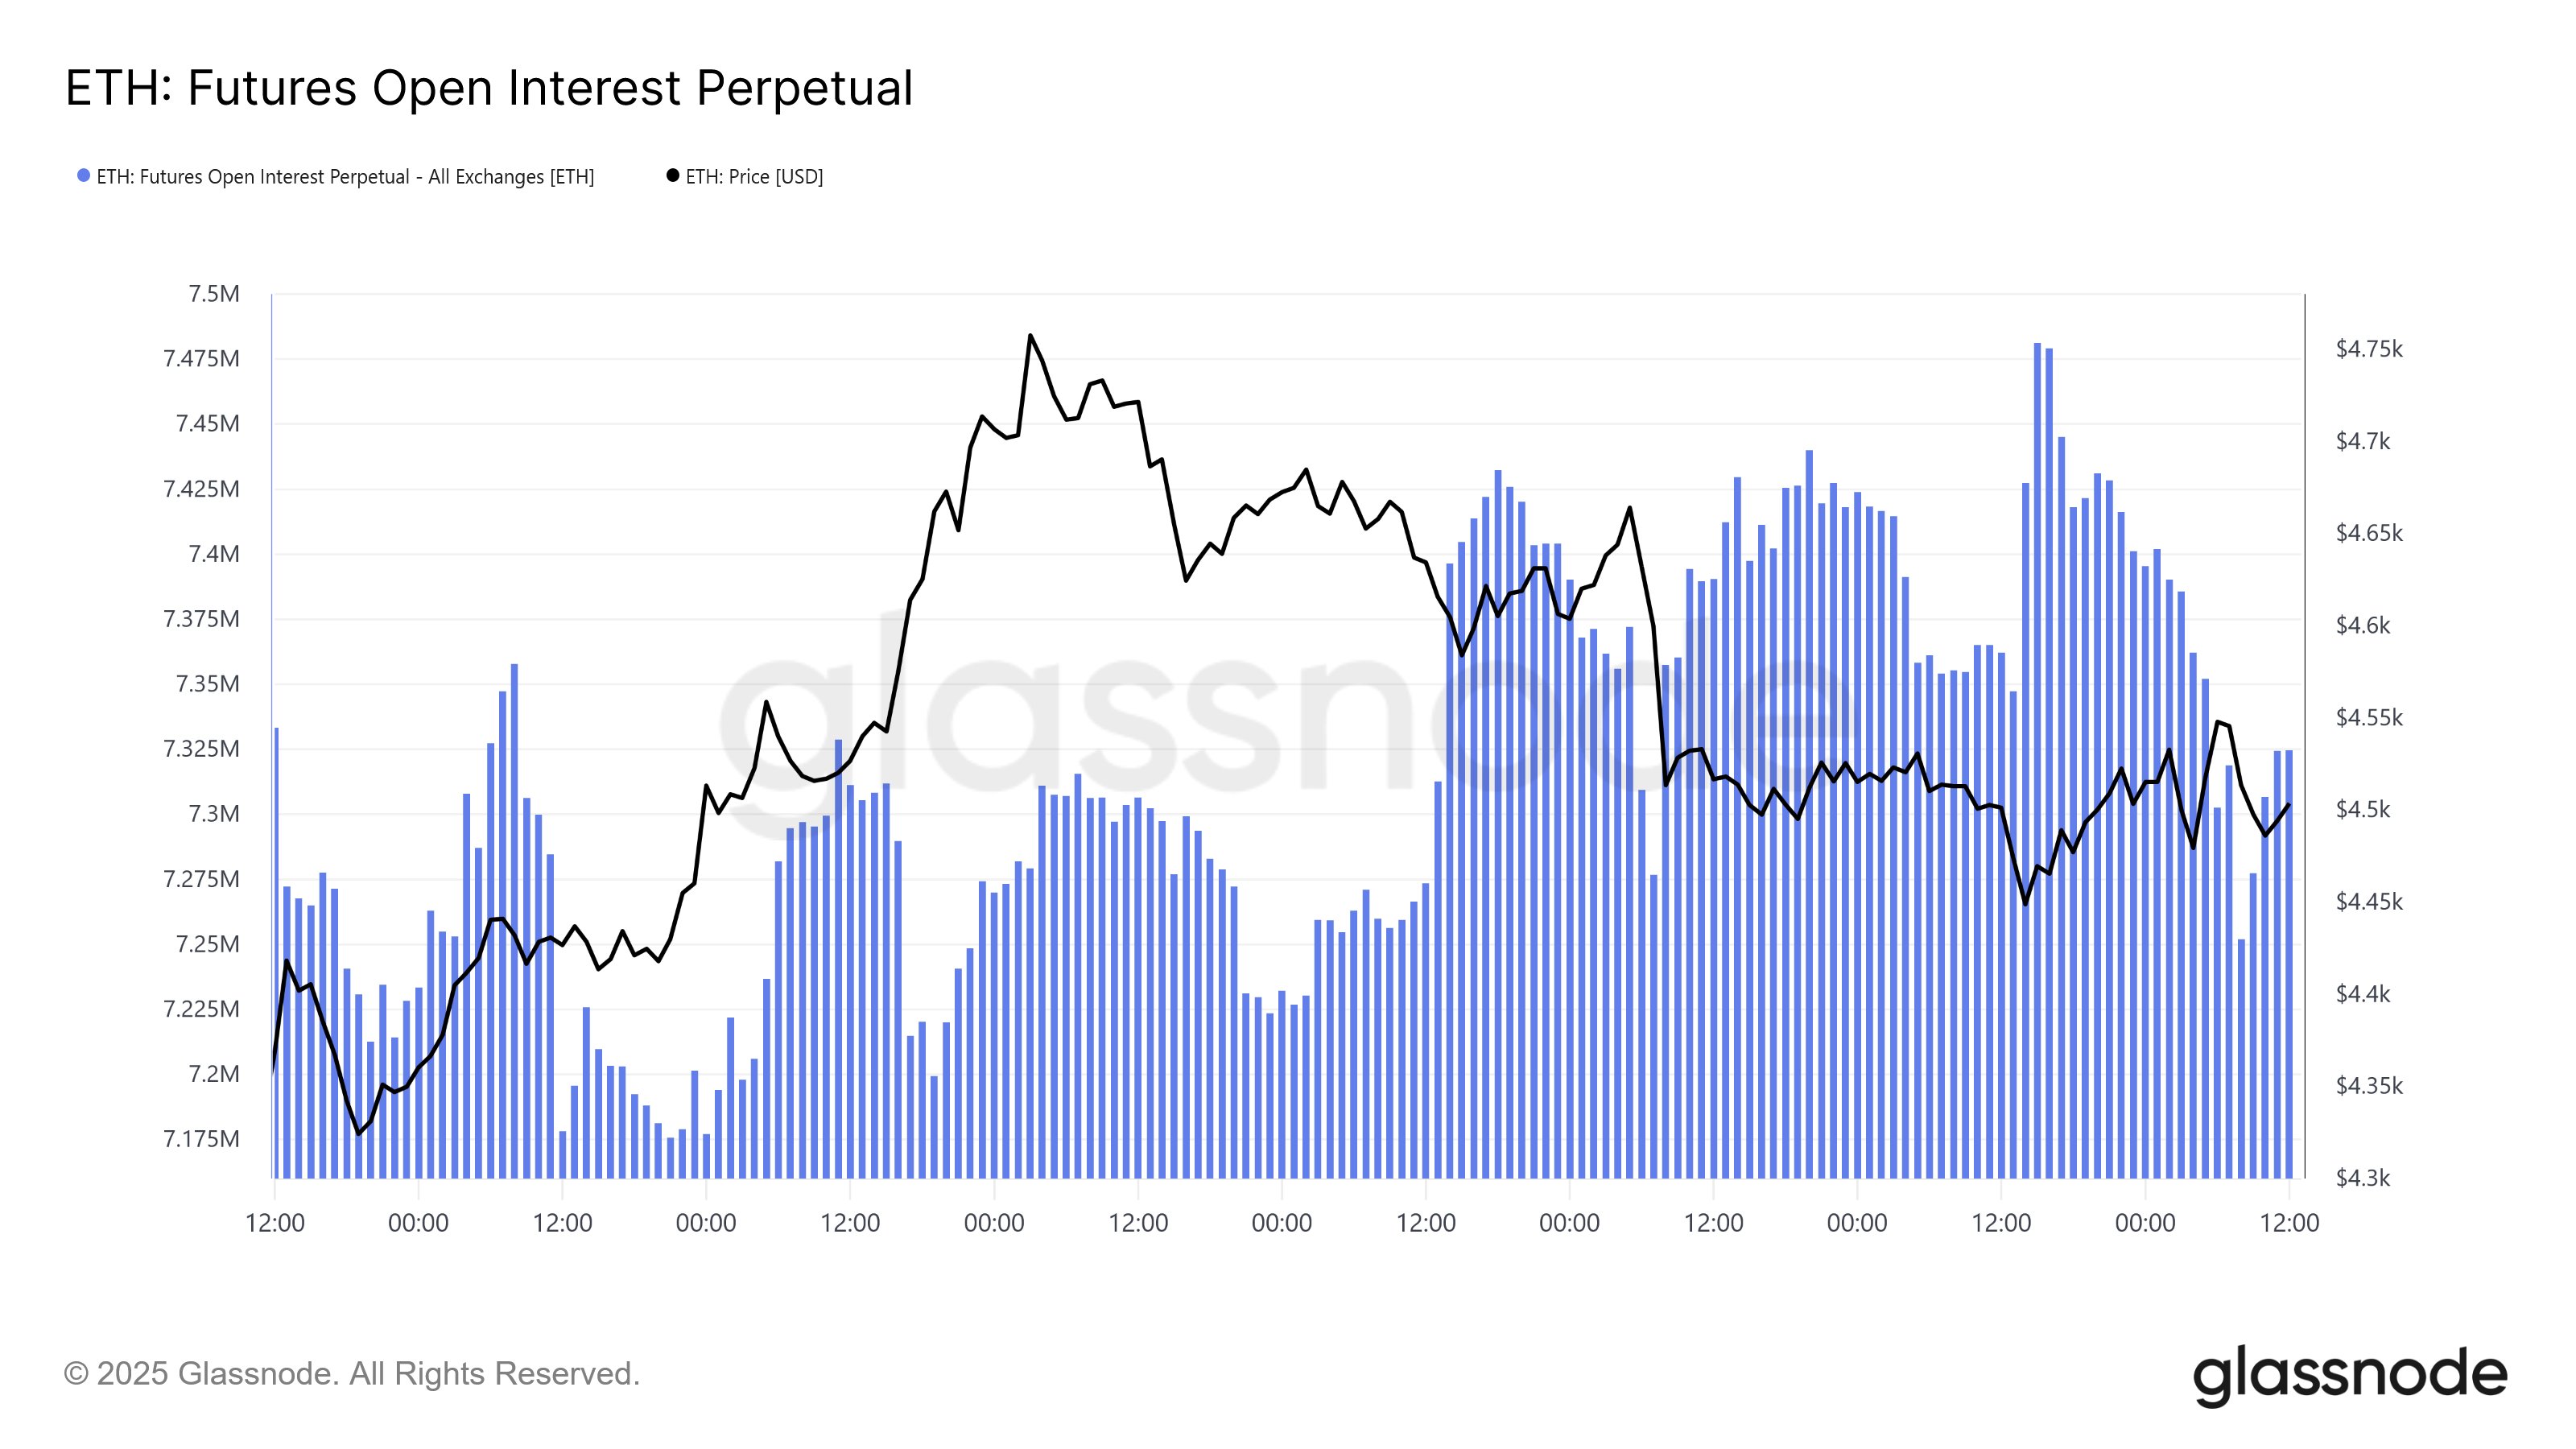
The analytics firm has pointed out that XRP and BNB have also observed a similar trend. Given this divergence that has formed between the assets, it’s possible that ETH and company may be in for higher volatility than BTC and SOL.

BTC Price

Bitcoin recovered to $117,900 on Wednesday, but it seems the coin has seen a minor pullback since then as it’s now back at $117,000.

Bitcoin Price Chart

Market Opportunity
XRP Logo
XRP Price(XRP)
$1,8952
$1,8952$1,8952
-3,20%
USD
XRP (XRP) Live Price Chart
Disclaimer: The articles reposted on this site are sourced from public platforms and are provided for informational purposes only. They do not necessarily reflect the views of MEXC. All rights remain with the original authors. If you believe any content infringes on third-party rights, please contact service@support.mexc.com for removal. MEXC makes no guarantees regarding the accuracy, completeness, or timeliness of the content and is not responsible for any actions taken based on the information provided. The content does not constitute financial, legal, or other professional advice, nor should it be considered a recommendation or endorsement by MEXC.

You May Also Like

Is Putnam Global Technology A (PGTAX) a strong mutual fund pick right now?

Is Putnam Global Technology A (PGTAX) a strong mutual fund pick right now?

The post Is Putnam Global Technology A (PGTAX) a strong mutual fund pick right now? appeared on BitcoinEthereumNews.com. On the lookout for a Sector – Tech fund? Starting with Putnam Global Technology A (PGTAX – Free Report) should not be a possibility at this time. PGTAX possesses a Zacks Mutual Fund Rank of 4 (Sell), which is based on various forecasting factors like size, cost, and past performance. Objective We note that PGTAX is a Sector – Tech option, and this area is loaded with many options. Found in a wide number of industries such as semiconductors, software, internet, and networking, tech companies are everywhere. Thus, Sector – Tech mutual funds that invest in technology let investors own a stake in a notoriously volatile sector, but with a much more diversified approach. History of fund/manager Putnam Funds is based in Canton, MA, and is the manager of PGTAX. The Putnam Global Technology A made its debut in January of 2009 and PGTAX has managed to accumulate roughly $650.01 million in assets, as of the most recently available information. The fund is currently managed by Di Yao who has been in charge of the fund since December of 2012. Performance Obviously, what investors are looking for in these funds is strong performance relative to their peers. PGTAX has a 5-year annualized total return of 14.46%, and is in the middle third among its category peers. But if you are looking for a shorter time frame, it is also worth looking at its 3-year annualized total return of 27.02%, which places it in the middle third during this time-frame. It is important to note that the product’s returns may not reflect all its expenses. Any fees not reflected would lower the returns. Total returns do not reflect the fund’s [%] sale charge. If sales charges were included, total returns would have been lower. When looking at a fund’s performance, it…
Share
BitcoinEthereumNews2025/09/18 04:05
QNT Technical Analysis Jan 21

QNT Technical Analysis Jan 21

The post QNT Technical Analysis Jan 21 appeared on BitcoinEthereumNews.com. QNT’s MACD histogram showing a positive trend and RSI stabilizing in the neutral zone
Share
BitcoinEthereumNews2026/01/21 23:54
SHIB Alert: First Three-Hour Death Cross Flashes on Chart in 2026, Is It Important?

SHIB Alert: First Three-Hour Death Cross Flashes on Chart in 2026, Is It Important?

The post SHIB Alert: First Three-Hour Death Cross Flashes on Chart in 2026, Is It Important? appeared on BitcoinEthereumNews.com. Shiba Inu is forming a death cross
Share
BitcoinEthereumNews2026/01/22 00:26