

PEPE Eyes 55x Rally as Weekly Accumulation Zone Signals Major Breakout
PEPE traded near $0.00000376 in a weekly accumulation zone, with $0.000006 marked as the key breakout level.
PEPE is drawing fresh market attention after a new chart outlook pointed to a possible long-term breakout from a major weekly accumulation zone.
The latest analysis by Crypto Patel said the memecoin is trading inside a high-confluence area where a fair value gap, an order block, and horizontal support meet.
With PEPE near $0.00000376, traders are now watching whether that structure can hold and support a larger move in the current market cycle.
Weekly Structure Puts Focus on PEPE Accumulation Zone
According to the shared analysis, PEPE is holding inside a weekly demand region between $0.0000030 and $0.0000018.
The setup is described as a rare confluence zone because several technical levels are aligned in one area.
Crypto Patel said this structure includes a weekly fair value gap, an order block, and horizontal support.
The report linked the current setup to an earlier PEPE cycle. It said a similar structure formed before the token posted a 4,515% rise in 2023.
Based on that comparison, the analyst projected a possible 5,592% move in the current cycle, or about 55x from present levels, if the pattern holds.
The same outlook placed invalidation below $0.0000017. That level is now a key downside marker for traders following the weekly structure.
On the upside, the analysis said PEPE would turn “super bullish” if price breaks and holds above $0.000006.
Long-term price targets in the report ranged from $0.000028 to $0.0001.
Those targets remain conditional on price holding the accumulation zone and confirming strength above near-term resistance.
The chart view has added to interest around PEPE’s long-range direction.
Daily Chart Shows Recovery, but Resistance Still Holds
While the weekly view has drawn attention, the daily chart still shows a more cautious picture.
PEPE remains in a broader downtrend, although recent price action has improved.
The token traded near $0.00000374 on the chart, which placed it above the March lows but below major resistance.
After a prolonged decline, PEPE began to form a base near $0.00000320 to $0.00000330.
Since then, price has moved in a tighter range and has shown a mild upward drift.
Recent candles suggest that selling pressure has eased, while buyers have started to absorb supply during dips.
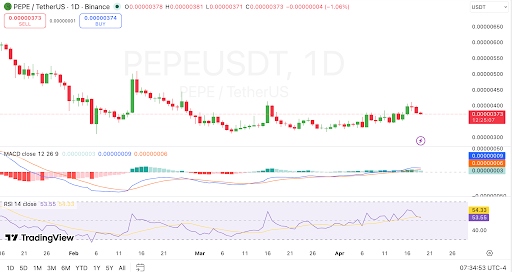 PEPE steadies near resistance as daily momentum improves source TradingView
The immediate resistance zone remains near $0.00000390 to $0.00000400.
A daily close above that area would strengthen the bullish case and could open the way toward $0.00000420 and $0.00000450.
Until then, the market remains inside a consolidation range rather than a confirmed breakout trend.
Support remains visible at several lower levels. The first area is near $0.00000370 to $0.00000374, while stronger support sits near $0.00000350 to $0.00000355.
Below that, the March low region near $0.00000320 to $0.00000330 remains the next key floor.
Read Also:
Momentum Signals Improve as Traders Watch Breakout Levels
Momentum indicators on the daily chart show early signs of improvement. The MACD histogram has turned slightly positive, and the MACD line appears to be near or above the signal line.
Both lines are rising, although the move remains modest. The RSI reading near 53.85 also points to improving strength.
That level places PEPE above the neutral 50 mark, but still below overbought territory.
This suggests buyers have gained some control, yet the chart does not show a strong breakout signal at this stage.
The latest market view argues that PEPE is mirroring a previous accumulation structure with a “breakdown, retest, sweep, and demand reclaim.”
That comparison has led traders to track the token more closely. Still, confirmation will depend on whether PEPE can break above short-term resistance and maintain support above the current base.
For now, PEPE is holding a closely watched weekly zone, while the daily chart shows gradual recovery.
The next moves around $0.00000400 and $0.000006 are likely to remain central to market positioning.
The post PEPE Eyes 55x Rally as Weekly Accumulation Zone Signals Major Breakout appeared first on Live Bitcoin News.


You May Also Like

Pi Network Protocol v23 Introduces Smart Contracts and New Payment Systems for Web3 Expansion

XRP Breaks the Banking Control. XRP Is Shifting Control Across the System


