Ethereum Price Prediction: ETH Breakout Above $2,385 Puts $2,900 in Focus
Key Insights:
- Ethereum price broke above the $2,385 triangle resistance level, turning a key ceiling into support and opening a technical path toward $2,900.
- Analysts now watch $2,480 for a daily close that could confirm the breakout and weaken the current TD Sequential sell signal.
- ETH has also reclaimed its 100-day SMA, while the $2,385 to $2,480 range remains the key zone for the next move
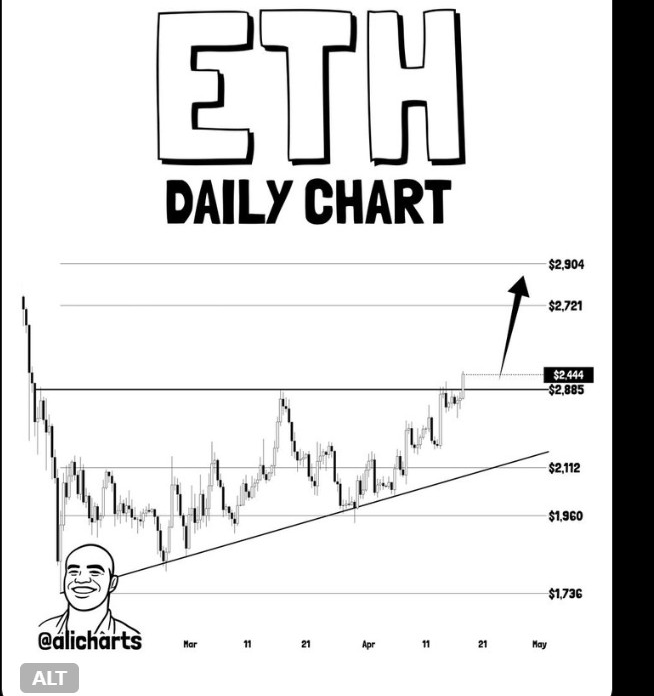
Ethereum price moved above the $2,385 resistance area and shifted market attention to higher chart levels. The move followed a steady climb within an ascending triangle on the daily chart. Ali Martinez showed ETH reclaiming its 100-day simple moving average during the move. With the altcoin price now above a key barrier, the next technical target on the structure stands near $2,900.
Ethereum Price Clears a Key Resistance Zone
Ethereum traded for several weeks within an ascending triangle, with support from the March lows and repeated tests of overhead resistance. That pattern started to tighten in April as ETH crypto price pushed closer to the top of the range. The latest move carried ETH above the $2,385 area, which had capped earlier advances.
The breakout changed the short-term chart structure. Resistance at $2,385 now becomes the first support zone to watch on daily closes. If ETH continues to hold above that level, the move will keep the breakout structure active and the upside target in view.
Additionally, ETH price is trading within a buy wall zone, which may offer near-term support if buyers remain active. Order book data also shows a fresh sell wall around $2,440, placing immediate resistance just above the current range.
 ETHUSD 1Hr Chart | Source: X
Beyond that, the next visible sell wall stands near $2,650, marking another level traders may watch if price pushes higher. As long as ETH holds above support and absorbs nearby selling pressure, the current setup leaves room for a move toward the higher resistance band.
ETH Crypto Close Above $2,480 Remains in Focus
While Ethereum price has moved through the earlier resistance band, another level remains important on the daily chart. Ali Martinez pointed to a daily close above $2,480 as the next signal that could strengthen the breakout case. That level matters because it would place price above the recent upper range and reduce the weight of the sell setup seen on the chart.
The same chart also showed a TD Sequential sell signal near the latest rally zone. The last time a similar signal appeared near $2,400, ETH pulled back toward support before recovering. Because of that setup, the market is now watching whether ETH can keep gaining ground rather than stalling in the same area.
 ETHUSD | Source: X
Alongside the breakout attempt, ETH has also reclaimed its 100-day simple moving average on the daily timeframe. That move often draws attention because it places price back above a medium-term trend marker. In this case, the recovery above that average adds support to the current structure after weeks of uneven movement.
The chart also shows a rising support line that has held since the March low. ETH bounced from that trendline more than once before returning to the upper edge of the triangle. As long as price remains above both the breakout zone and that rising support line, the pattern stays intact on the daily chart.
$2,900 Target Comes From the Triangle Structure
The $2,900 target comes from the measured move of the ascending triangle. After price broke above the upper boundary, the height of the pattern projected a move toward that area. On the chart, the next upside region is near $2,721 first, then close to $2,904 if momentum continues.
Markets often revisit breakout areas before extending higher, especially after a strong move into resistance. For now, traders are tracking whether ETH can hold above $2,385 and then secure a daily close above $2,480.
If ETH holds those levels, the daily structure continues to favor a move toward the upper targets on the chart. If price slips back below the breakout zone, attention may shift back to the rising support near the low $2,100 area.
The post Ethereum Price Prediction: ETH Breakout Above $2,385 Puts $2,900 in Focus appeared first on The Market Periodical.


You May Also Like

Silver Price Forecast: XAG/USD holds losses near $80.50 due to renewed inflation concerns

Pulsz Social Casino Expands Gaming Portfolio in 2026