BTC Spot CVD Analysis Reveals Powerful Order Flow Shifts on April 28
BitcoinWorld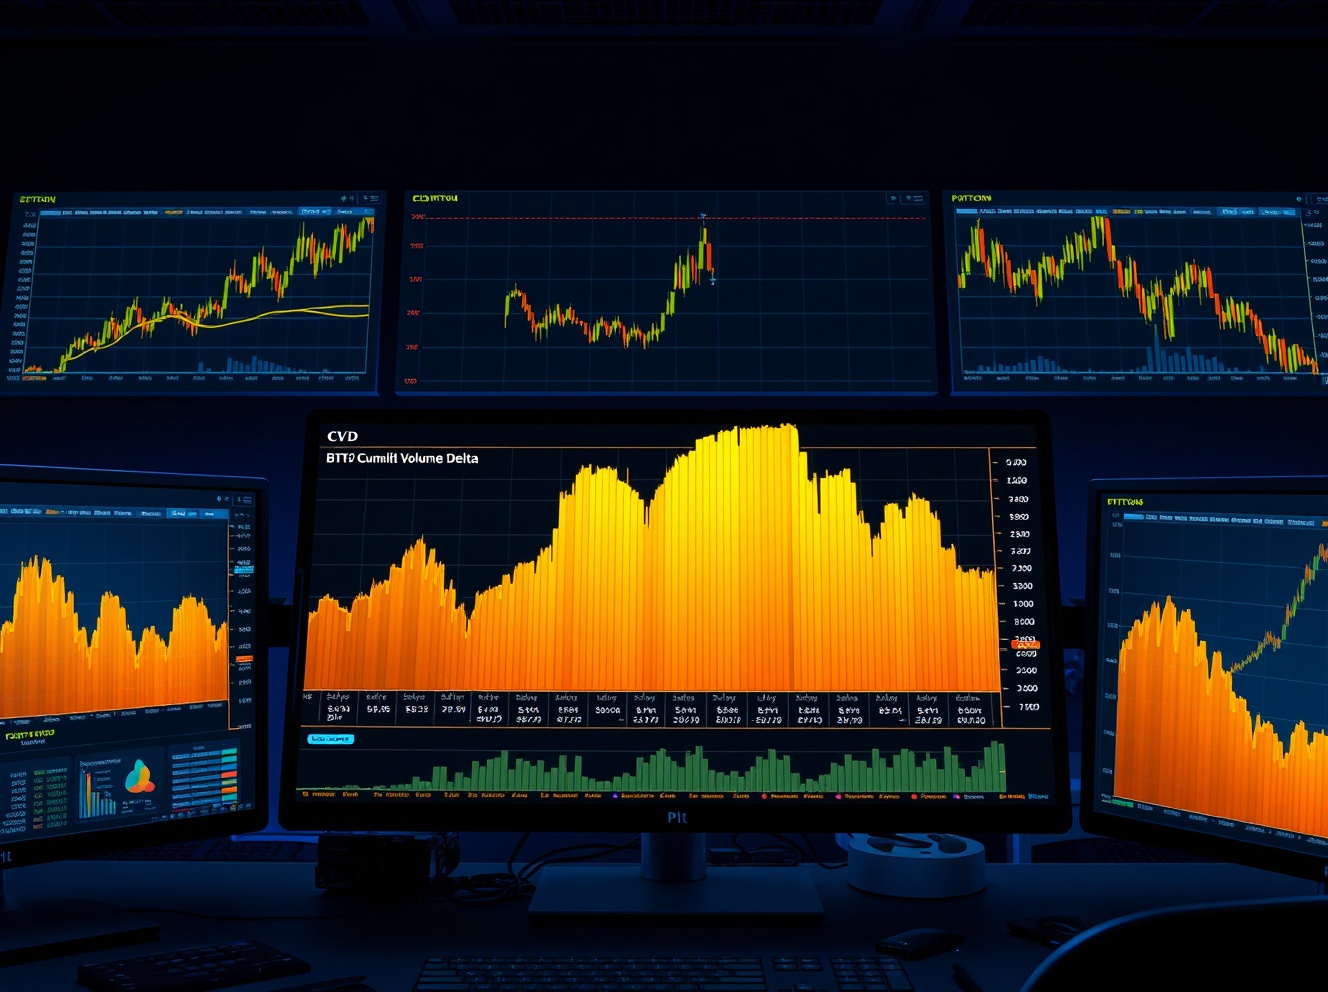
BTC Spot CVD Analysis Reveals Powerful Order Flow Shifts on April 28
Traders closely monitor the BTC Spot CVD chart as of 11:45 a.m. UTC on April 28 to gauge real-time buying and selling pressure. This analysis provides a granular view of the order book for the BTC/USDT spot pair. The chart combines a volume heatmap with a cumulative volume delta indicator. This data helps identify potential support and resistance levels. Understanding these flows is critical for short-term trading decisions.
Understanding the BTC Spot CVD and Volume Heatmap
The upper section of the chart features a Volume Heatmap. This heatmap tracks trading volume at specific price levels. The background brightens in areas where the price lingers or moves significantly. These brighter zones often act as support or resistance. For example, a high-volume node at $30,000 may indicate strong buyer interest. Conversely, a bright zone at $31,000 could signal selling pressure. Traders use this information to anticipate price reactions. The heatmap updates in real-time, reflecting market activity as it happens.
Decoding the Cumulative Volume Delta (CVD)
The lower section displays the Cumulative Volume Delta (CVD) indicator. This indicator represents buy and sell orders categorized by trade size. As buy orders increase, the corresponding colored line rises. For instance, the yellow line tracks orders between $100 and $1,000. The brown line tracks large orders between $1 million and $10 million. A rising CVD line suggests aggressive buying. A falling CVD line indicates selling pressure. This granular data helps traders identify the actions of retail and institutional participants.
Key Order Size Categories in the CVD Chart
- Yellow Line: Orders between $100 and $1,000 (retail traders).
- Blue Line: Orders between $1,000 and $10,000 (small to mid-size traders).
- Green Line: Orders between $10,000 and $100,000 (large individual traders).
- Red Line: Orders between $100,000 and $1 million (whales and institutions).
- Brown Line: Orders between $1 million and $10 million (major institutional flows).
Real-World Context for the April 28 Data
On April 28, the BTC price traded within a narrow range. The BTC Spot CVD chart showed a divergence between retail and institutional flows. The yellow line (small orders) showed steady buying. However, the brown line (large orders) indicated a slight decline. This divergence often precedes a short-term price move. Traders interpret this as potential weakness in the uptrend. The volume heatmap showed a bright zone near $29,800. This level has acted as support in previous sessions.
Expert Perspectives on Order Flow Analysis
Market analysts emphasize the importance of order flow analysis. “The CVD indicator provides a direct view of market aggression,” says a senior crypto analyst. “It shows who is in control: buyers or sellers.” Another expert notes that combining the CVD with the volume heatmap increases accuracy. “When the heatmap shows a high-volume node and the CVD turns positive, it confirms strong support.” These insights help traders avoid false breakouts.
Practical Applications for Traders
Traders use the BTC Spot CVD chart for entry and exit points. A rising CVD with a bright heatmap zone suggests a good buying opportunity. A falling CVD near a resistance zone signals a potential sell. The chart also helps identify market manipulation. For instance, a sudden spike in the brown line (large orders) may indicate a whale accumulating. Traders can follow these signals for short-term gains.
Timeline and Market Impact
The data from 11:45 a.m. UTC on April 28 comes during a period of low volatility. Bitcoin has been consolidating after a recent rally. The BTC Spot CVD chart shows that retail buying is absorbing institutional selling. This balance keeps the price stable. If the brown line continues to decline, a breakout could occur. Traders watch for a catalyst, such as a macroeconomic event or regulatory news.
Conclusion
The BTC Spot CVD chart from April 28 provides critical insights into Bitcoin order flow. The volume heatmap identifies key support and resistance levels. The cumulative volume delta reveals the actions of different trader groups. Retail traders are buying, while institutions show slight selling. This divergence may lead to a price move. Traders should monitor these indicators for timely decisions. Understanding the CVD and heatmap enhances trading strategy.
FAQs
Q1: What is the BTC Spot CVD chart used for?
The BTC Spot CVD chart analyzes real-time buying and selling pressure by tracking cumulative volume delta and order flow at specific price levels.
Q2: How does the volume heatmap help traders?
The volume heatmap highlights price levels with high trading activity. These bright zones often act as support or resistance for future price movements.
Q3: What does a rising CVD line indicate?
A rising CVD line indicates that buy orders are increasing relative to sell orders. This suggests aggressive buying pressure in the market.
Q4: Why is the brown line important in the CVD chart?
The brown line tracks large orders between $1 million and $10 million. It represents institutional activity and can signal major market moves.
Q5: Can the CVD chart predict price movements?
While not a predictor, the CVD chart provides data on current market aggression. Combined with other indicators, it helps traders make informed decisions.
This post BTC Spot CVD Analysis Reveals Powerful Order Flow Shifts on April 28 first appeared on BitcoinWorld.


You May Also Like

Crypto Hack: Drift Protocol Drained Over $200M in Private Key Breach

USD/CAD firms near 1.3670 ahead of Fed-BoC rate calls