Hyperliquid (HYPE) Price: Multi-Day Uptrend Breaks as Momentum Fades
TLDR
- HYPE’s 62-day uptrend has broken after a decisive trendline breach
- Price is printing lower highs, failing to recover mid-$40s levels
- Social dominance has dropped from 0.688% to 0.137% since March
- Open Interest in HYPE futures rose ~3% to $1.66 billion in 24 hours
- HYPE is trading around $42, holding above key EMAs at $38.98 and $34.90
Hyperliquid (HYPE) has broken a 62-day uptrend that had been defined by a clear ascending trendline and a steady series of higher lows. The break was decisive rather than gradual, pointing to a shift in market control rather than simple consolidation.
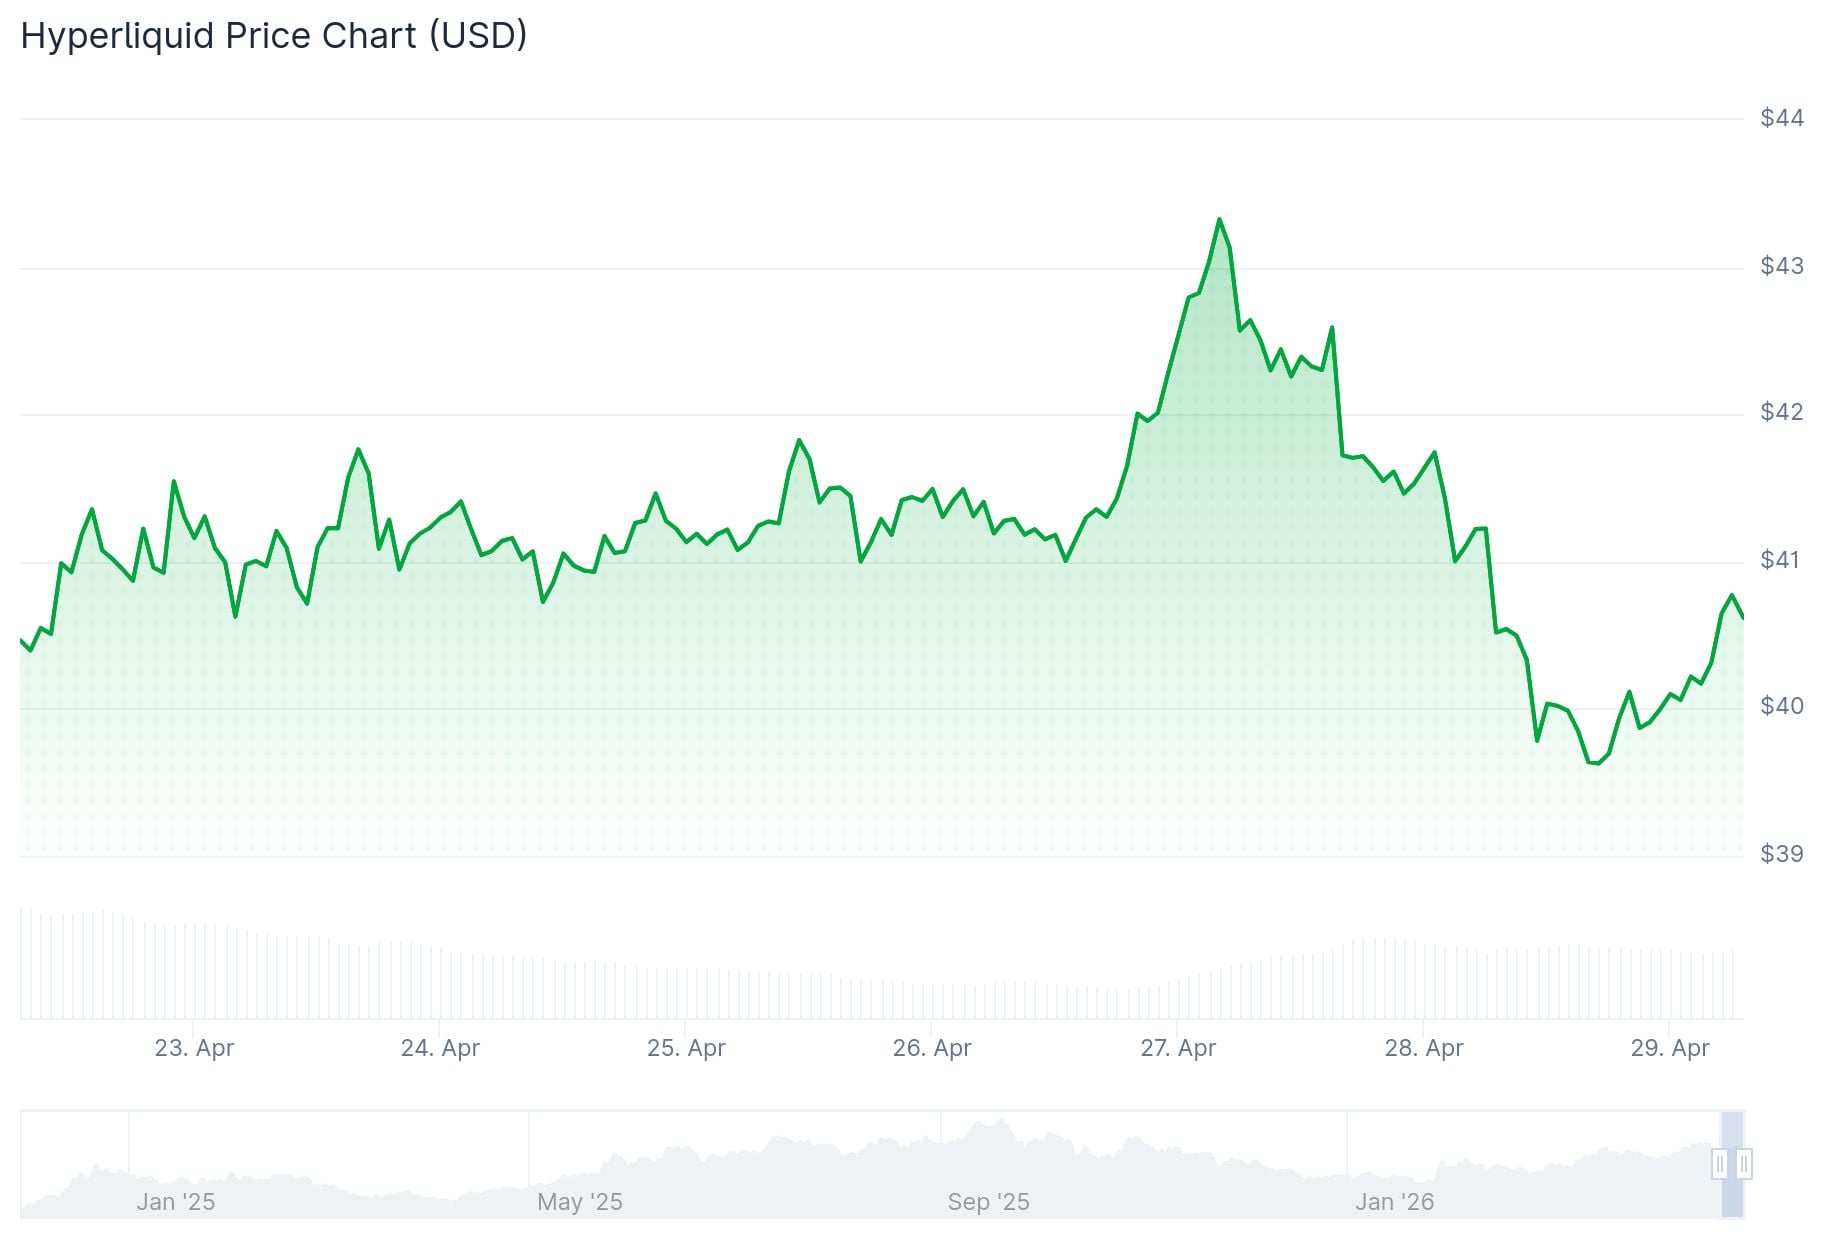 Hyperliquid (HYPE) Price
After the trendline failed, the most recent price bounce printed a lower high, falling short of the mid-$40s peak seen earlier in the trend. That lower high is an early sign that buyers are losing grip.
Moving averages are beginning to flatten, and prices are slipping back toward them rather than bouncing cleanly off them. That kind of behavior often marks the end of an expansion phase.
Volume tells a similar story. The earlier part of the uptrend saw steady participation, but recent price action shows less follow-through. The breakdown itself was not accompanied by panic selling, which suggests this is a loss of demand rather than a capitulation event.
Social Interest Cools
Crypto analytics firm Santiment shows HYPE’s social dominance has fallen to 0.137%, down sharply from a spike of 0.688% on March 30. That earlier spike came during the height of US-Iran tensions, when Hyperliquid’s oil futures trading drew attention. As geopolitical pressure has eased, retail interest has cooled.
 Source: Santiment
Analyst Rand Group noted on social media that revenue data is one of the few honest metrics in crypto. “No narratives. No airdrops. No ghost wallets. No fake speeds. Just who is actually printing and being profitable,” they wrote. That framing puts a spotlight on whether Hyperliquid’s fundamentals can support the price when sentiment fades.
Futures Market Still Active
Despite the cooling social interest, the derivatives market shows continued positioning. Open Interest in HYPE futures climbed roughly 3% in 24 hours to $1.66 billion according to CoinGlass. The funding rate sits at 0.0077%, and has remained mostly positive over the past month, reflecting ongoing leveraged long positioning.
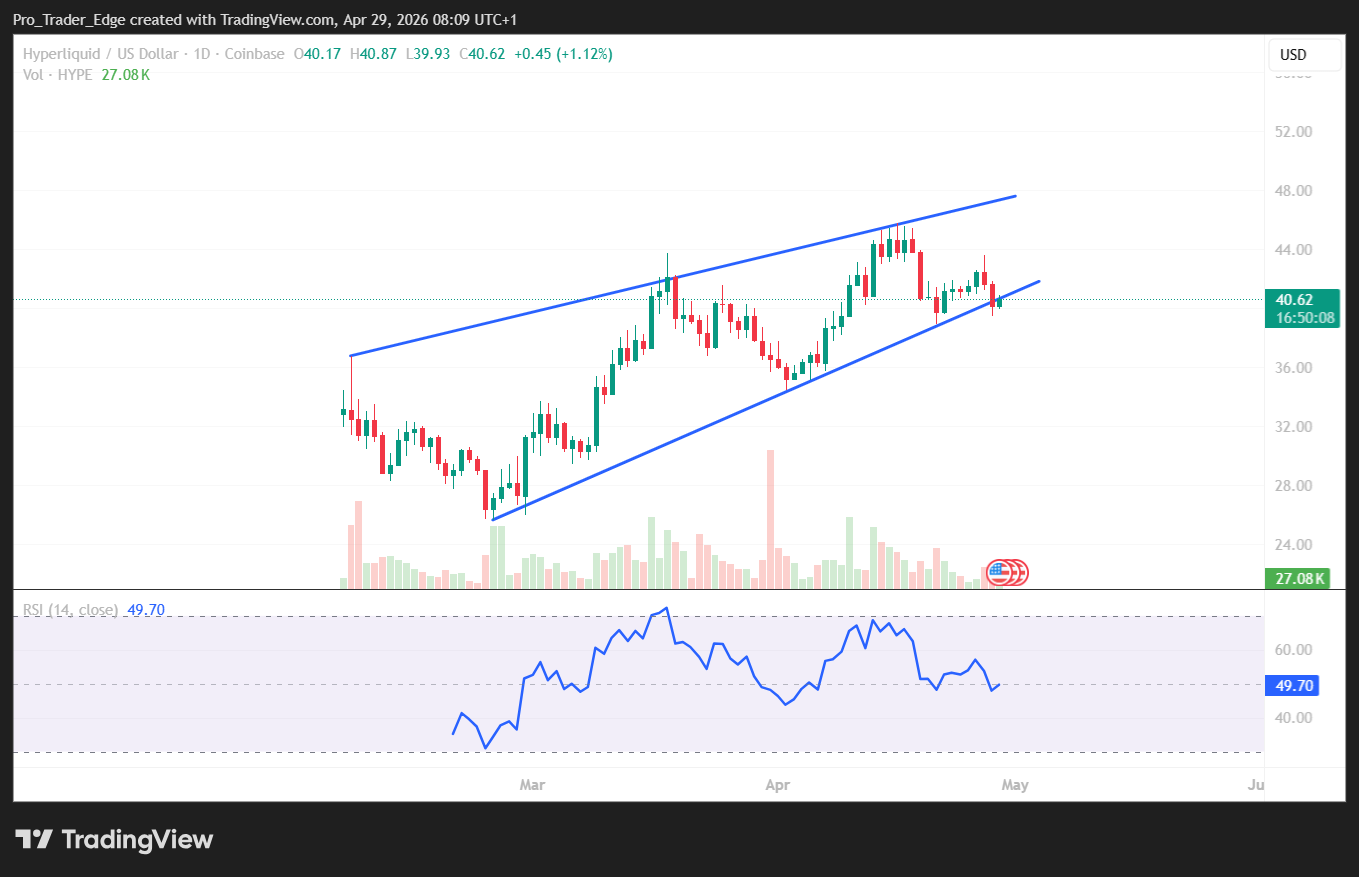 Source: TradingView
On the technical side, HYPE trades around $42, sitting above its 50-day EMA at $38.98 and its 200-day EMA at $34.90. The RSI reads 57, which is positive without being overbought. The MACD is moving toward its signal line.
The R1 Pivot Point at $43.71 is acting as near-term resistance, with the overhead trendline sitting around $46.80.
HYPE is currently holding above trendline support at $41.21. A daily close below that level would bring the 50-day EMA at $38.98 into play, with the 200-day EMA at $34.90 as the next key level below that.
The post Hyperliquid (HYPE) Price: Multi-Day Uptrend Breaks as Momentum Fades appeared first on CoinCentral.


You May Also Like

AurumX Joins PinGo to Accelerate Decentralized AI Infrastructure via TON
USD/INR: 95.23 Retest Risk Looms as Societe Generale Flags Intensifying INR Pressure