S&P 500 (SPX) Approaches Critical Resistance Zone: What Investors Need to Know
Key Takeaways
- The S&P 500 maintains its upward trajectory but faces significant channel resistance between 7,100 and 7,250
- Economic expansion decelerated sharply to 0.5% annual rate in Q4 2025, a substantial decline from Q3’s 4.4%
- Consumer price inflation accelerated to 3.3% in March, complicating Federal Reserve policy decisions
- Analysts forecast robust 18.6% earnings expansion for 2026, providing fundamental support
- Breakdown beneath 6,400–6,500 range would signal significant bearish shift
The S&P 500 continues to demonstrate upward momentum, yet the landscape has become increasingly nuanced. Inflation pressures are resurging, economic expansion has decelerated, and the benchmark index now confronts a critical resistance area.
Let’s examine the current technical and fundamental environment.
The benchmark is currently trading adjacent to the upper boundary of its established multi-year ascending channel, approximately 7,100–7,250. This zone has previously acted as a ceiling during prior rallies. While the market structure remains constructive, it no longer occupies a favorable risk-reward position.
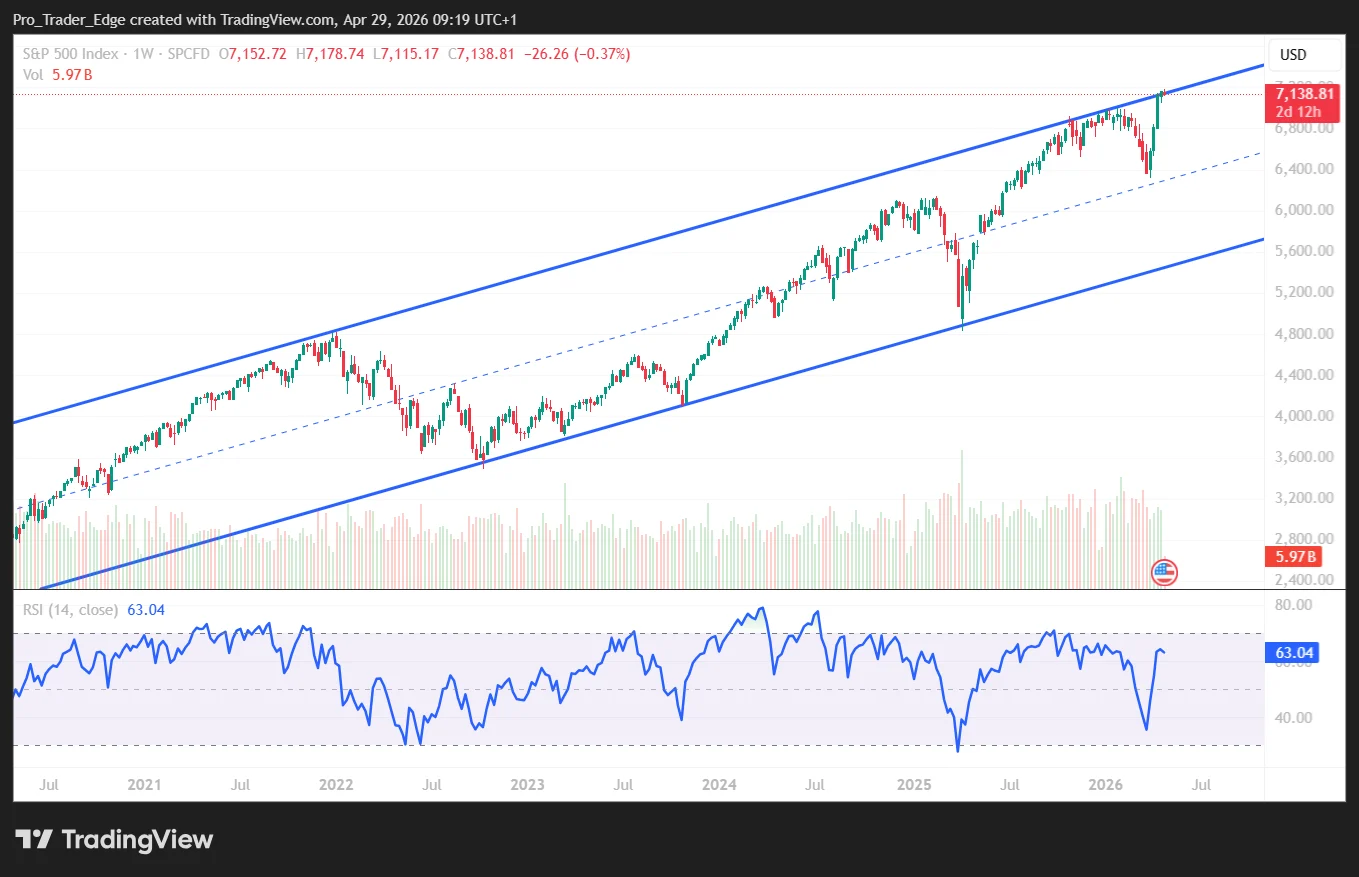 Source: TradingView
Immediate support exists in the 6,800–6,900 region. A retracement that finds stability at this level would represent typical consolidation behavior. The more critical support zone lies at 6,400–6,500, marking the launch point of the latest advance.
According to Bureau of Economic Analysis data, U.S. real GDP expanded at just 0.5% on an annualized basis during Q4 2025. This represents a dramatic deceleration from the prior quarter’s 4.4% pace. While positive growth continues, the trajectory has clearly weakened.
Concurrently, price pressures have intensified. The March Consumer Price Index registered a 3.3% year-over-year increase, up considerably from February’s 2.4% reading. Core CPI measured 2.6%. Energy costs played a significant role, with gasoline prices surging 18.9% annually.
The Federal Reserve maintains its benchmark rate within a 3.50%–3.75% range. Given the renewed inflationary momentum, the rationale for aggressive rate reductions has diminished. Elevated interest rates continue to constrain equity valuations, particularly impacting growth-oriented companies.
The Bullish Perspective
The optimistic scenario centers on corporate profitability. According to FactSet projections, S&P 500 constituents are expected to deliver 18.6% earnings growth throughout 2026. Notably, all eleven sectors are currently posting positive year-over-year revenue growth during this reporting season.
Should corporate profits meet expectations and inflationary pressures moderate following the energy-driven spike, the market can justify elevated prices despite above-average valuations.
A definitive weekly close above the 7,200–7,250 threshold would constitute a bullish technical signal. Subsequent targets would emerge around 7,400, followed by 7,600.
The constructive case also requires recession probability to remain low. Assuming employment conditions stay resilient and credit markets remain stable, investors will likely continue deploying capital during temporary weakness.
The Bearish Perspective
The pessimistic argument begins with valuation metrics. The S&P 500 currently trades at a forward price-to-earnings multiple of 20.9. This exceeds both the five-year average of 19.9 and the ten-year average of 18.9, per FactSet data.
While elevated valuations don’t guarantee a correction, they reduce the margin for error should earnings falter or Treasury yields advance further.
Additionally, the index is testing the upper boundary of its rising channel. Though not inherently bearish, this positioning doesn’t represent an optimal entry opportunity.
A breakout failure above 7,200–7,250 followed by a reversal beneath 7,000 would constitute an initial cautionary signal. More significantly, a weekly close below 6,400–6,500 would indicate the recent uptrend has exhausted itself.
Potential catalysts for bearish price action include persistent inflation, climbing Treasury yields, or disappointing forward guidance from major corporations.
Final Thoughts
The S&P 500’s uptrend remains operational. Earnings expansion is tangible, buyers continue to emerge during pullbacks, and recession risk appears manageable rather than imminent.
Upcoming inflation reports and earnings guidance from major corporations reporting this quarter will provide the next meaningful directional signals.
The post S&P 500 (SPX) Approaches Critical Resistance Zone: What Investors Need to Know appeared first on Blockonomi.


You May Also Like

AurumX Joins PinGo to Accelerate Decentralized AI Infrastructure via TON

USD/INR: 95.23 Retest Risk Looms as Societe Generale Flags Intensifying INR Pressure