

BNB Bulls Eye Massive Cycle Trade as Burns, ETFs and Adoption Fuel Momentum
BNB trades near $618 as burn claims, ETF activity, adoption data, and key technical levels guide market focus.
BNB traders are watching the token after a sharp pullback from its recent cycle high.
The BNB/USDT daily chart shows price near $618, while market analysis points to burns, ETF activity, and chain adoption as possible drivers for the next cycle move.
Burns, ETF Activity, and Adoption Claims Shape the BNB Trade
Market analysis has focused on BNB burns and new investment products. One market post claimed that BNB auto-burns remove more than $1 billion each quarter.
Such claims should be checked against official burn data. The same post cited the first 2x leveraged BNB ETF in the United States.
It named Teucrium XBNB as the product. Traders often watch ETF products because they can widen market access.
The post also cited adoption on BNB Chain. It claimed 31 million daily transactions and 40% of global stablecoin volume.
These figures remain market claims unless confirmed by official network data. Other claims named tokenized assets on BNB Chain.
They included BlackRock’s BUIDL, Franklin Templeton’s BENJI, VanEck’s VBILL, and xAUT. The post also cited Bhutan and public company treasury activity.
BNB Price Trades Near a Critical Range
BNB is trading near $618 on the daily chart, based on the supplied TradingView data.
The token has pulled back from a recent high near $1,206. That decline placed price below several key Fibonacci retracement levels.
The chart shows BNB holding above the $600 area. This zone is now a near-term support level for traders.
The next major support sits near $552 to $560, based on the full retracement level at $552.77.
A daily close below $552.77 would weaken the current structure. It would also show that the prior rally has been fully retraced. Until then, price remains inside a recovery range.
Resistance is clear near $692 to $700. That area matches the 0.786 Fibonacci retracement at $692.72. A daily close above this zone could point to stronger demand.
Read Also:
Technical Indicators Show a Mixed Setup
The daily MACD remains slightly negative on the supplied chart. The histogram is near -1.61, while the MACD line is below the signal line.
This shows weak momentum, but selling pressure appears to have slowed. The MACD lines are also starting to flatten after the recent decline.
This can happen when a market moves from active selling into consolidation. However, the indicator has not yet confirmed a bullish crossover.
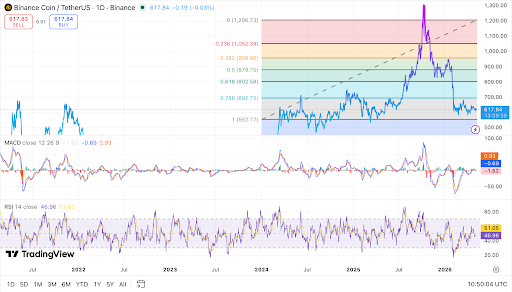 BNB trades near support as momentum remains mixed. Source: TradingView.
The RSI is near 47, while its average is close to 51. This places BNB near the middle of the momentum range. It also shows that buyers have not yet taken clear control.
A move above 50 to 55 on the RSI would support a firmer recovery. It would show improving demand and stronger daily momentum.
A drop below 40 would suggest that sellers are gaining strength again.
The chart still shows a neutral-to-bearish setup. BNB has not reclaimed the $692 to $700 resistance zone.
Buyers need that move before a bullish reversal gains more support. Price action near $600 also remains important for the short term.
Holding this area could help BNB build a base. Losing it could bring the $552 to $560 support zone back into focus.
The post BNB Bulls Eye Massive Cycle Trade as Burns, ETFs and Adoption Fuel Momentum appeared first on Live Bitcoin News.


You May Also Like

Solana price confirms bearish crossover following Drift exploit, will it crash?

EDX Markets Applies for OCC Trust Bank to Expand Crypto Services

Strait can only reopen in concertation with Iran


