

XRP Symmetrical Triangle Setup Points To Key Battle Near 1.90 Resistance
XRP trades near $1.43 as a tightening triangle setup puts focus on $1.80-$1.90 resistance, with $2.30 as the next chart level.
XRP traded near $1.43 on the daily chart as market focus moved toward a tightening symmetrical triangle setup.
The pattern shows price compression between rising support and falling resistance, while traders watch the $1.80 to $1.90 zone as the next major test.
A clean move above that area could place $2.30 back in view, but failure near resistance may keep XRP inside its broader range.
XRP Triangle Pattern Builds Near Key Resistance
XRP has continued to trade inside a narrowing structure on the daily chart.
The setup reflects lower highs and firmer support, which often shows reduced volatility before a larger move.
The current price sits below the descending resistance line near $1.45 to $1.50. A daily close above this area would be the first test for buyers.
It would also show whether momentum can extend toward higher resistance levels.
The wider resistance area remains between $1.80 and $1.90. This zone has been marked as a macro trend barrier by market watchers.
It also stands below the earlier high area near $2.30. A market analyst described the level as “the major battlefield” for XRP.
The comment reflects the market focus on whether buyers can clear this area with volume and follow-through.
Breakout Watch Remains Linked To $1.80–$1.90 Zone
The chart shows XRP attempting to recover from its April consolidation zone.
Recent candles have moved higher, but the price remains below the broader resistance structure.
A move above $1.50 may open the way toward $1.60 to $1.62. That area served as resistance during earlier trading.
Buyers would need a firm close above it to extend the move. If XRP reaches $1.80 to $1.90, the next reaction may guide the broader trend.
A breakout with strong volume could target the $2.30 region. That level matches a prior price area from the earlier rally.
However, a failed breakout remains a risk. The market has seen fast upside moves followed by deeper retests. Traders often watch for this type of move before a wider trend develops.
Read Also:
Support Levels And RSI Shape The Near-Term View
Immediate support sits near $1.38 to $1.40. A move below this area could send XRP back toward $1.30 to $1.32. This zone was held during recent consolidation.
The main structural support remains near $1.1184. This level is shown as a major base on the chart. A daily close below it would weaken the current structure.
The relative strength index stands near 57. This reading shows improving momentum, but it is not in overbought territory.
RSI above its moving average also shows mild buyer control.
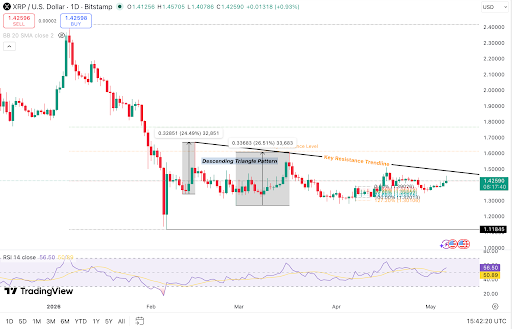 XRP price tests descending resistance as traders watch breakout levels. Source: TradingView.
A move above the 60 to 65 RSI area may support a stronger breakout attempt. Until then, XRP remains in a watch zone. The chart still shows short-term strength inside a larger compression pattern.
For now, XRP’s daily chart centers on the triangle setup and the $1.80 to $1.90 resistance band.
Traders are watching for confirmation, rejection, or a deeper retest before the next major move.
The post XRP Symmetrical Triangle Setup Points To Key Battle Near 1.90 Resistance appeared first on Live Bitcoin News.


You May Also Like

Institutional Moves Under Scrutiny — Bitcoin Buys Questioned

Cape Verde targeting World Cup knockout rounds after Uruguay draw, says coach

Iran’s Araghchi reports ‘major progress’ in US negotiations


