Bitcoin price Hits 200 EMA Wall as Spot BTC ETF Inflows Fall to $46M
Key Insights
- Bitcoin price continues its recent rally and is now hovering at its highest point since January.
- The coin has formed a rising wedge pattern, pointing to a reversal.
- Spot Bitcoin ETF inflows rose by $46 million, much lower than a day earlier.
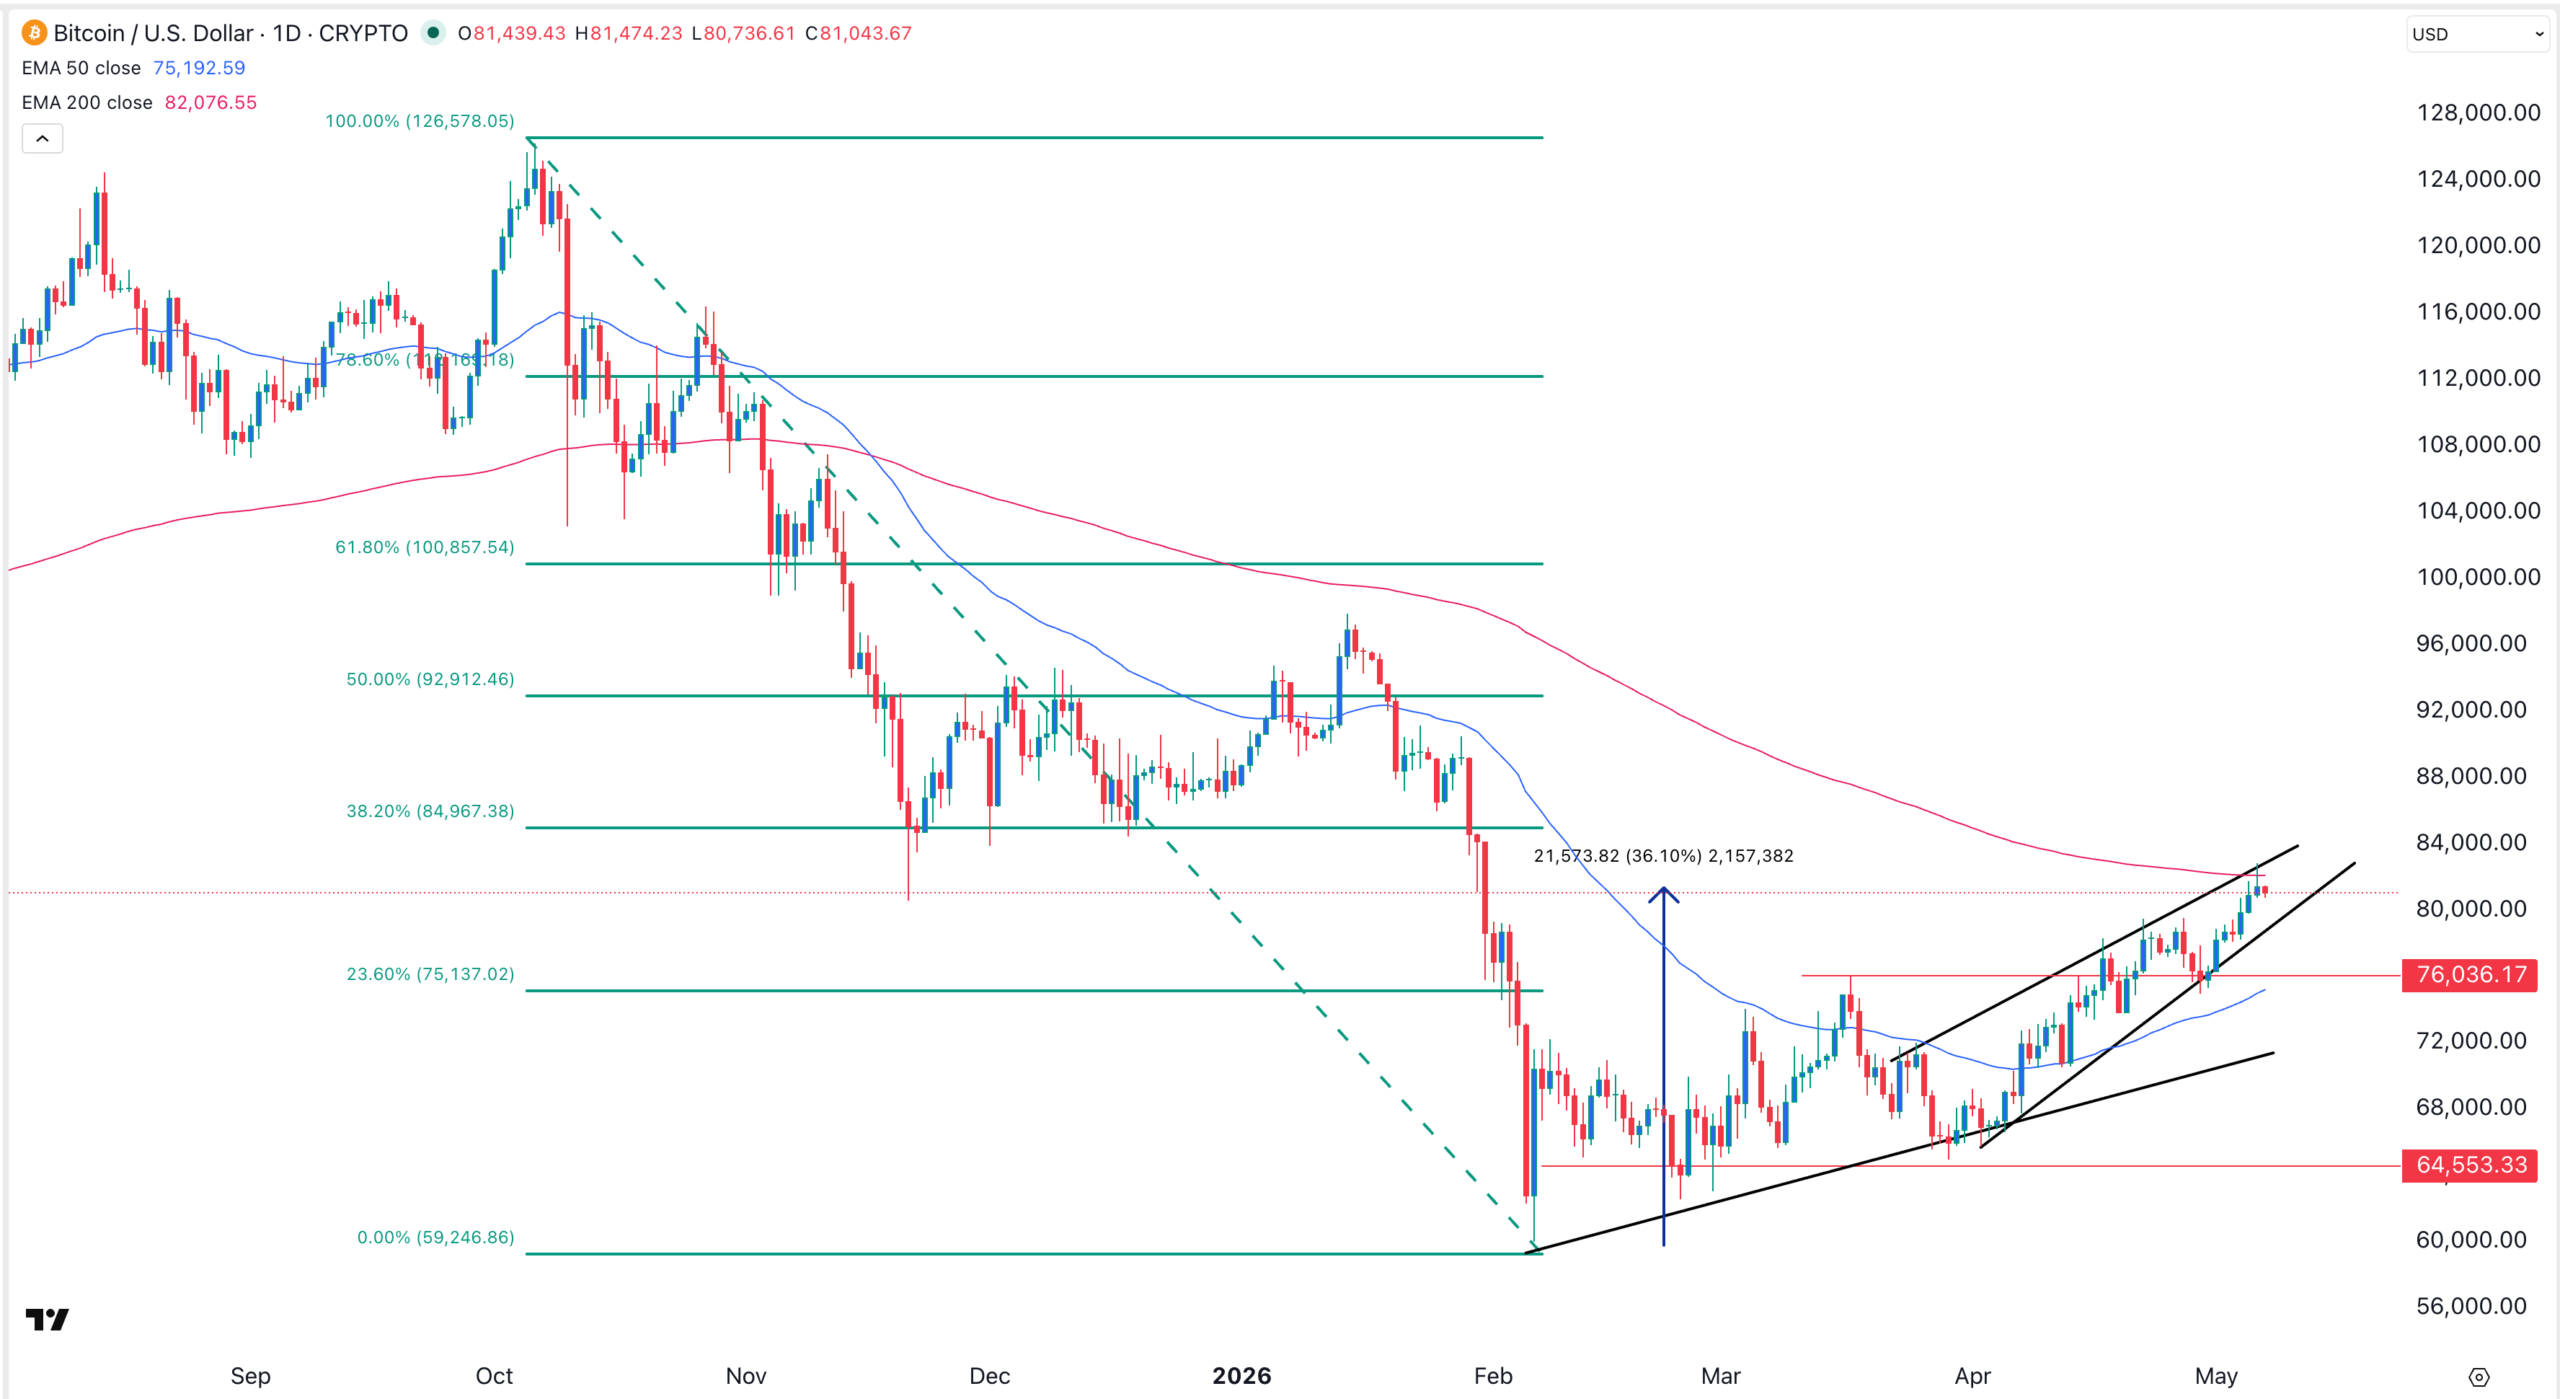
Bitcoin price continued its recent rally this week as it jumped to the highest level since January 31st. This rally may now be at risk after hitting the 200-day EMA and after forming the risky rising wedge pattern.
Bitcoin Price at Risk After Hitting the 200-Day Moving Average
The daily chart shows that the Bitcoin price has been in an uptrend this month. This happened as crypto traders embraced a risk-on sentiment.
This rally, however, may now be at risk for two main reasons. First, it has formed a rising wedge pattern, which comprises two ascending and converging trendlines. A bearish breakdown normally happens when these two lines are nearing their confluence, which is about to happen now.
The coin has also found a strong wall at the 200-day moving average. In most cases, a stock or crypto normally drops after hitting this resistance level. However, crossing the moving average signals that bulls have prevailed, which pushes it higher.
 BTC price chart | Source: TradingView
Rising above the 200-day moving average also raises the possibility that the coin will form a golden cross pattern. This happens when the two averages cross each other. It often confirms the narrative that the short-term momentum is continuing
The other technical risk is that Bitcoin formed a small shooting star candlestick on May 6. This pattern normally points to a reversal.
Therefore, the most likely Bitcoin price prediction is moderately bearish as the rally starts stalling. If this happens, the next important target to watch will be at $76,036, its highest point in March this year.
However, a surge above the 200-day moving average will point to more upside, potentially to the 50% Fibonacci retracement level at $92,912.
Spot Bitcoin ETFs Lost Momentum on Wednesday
One main reason why the BTC price has jumped is that investors have continued to pile into spot ETFs. Per SoSoValue, the spot Bitcoin ETFs have added $1.68 billion in assets in the first four days of this month. These are huge numbers since they has $1.97 billion in inflows in the whole of April.
The challenge, however, is that the momentum faded on Wednesday as these funds added just $46 billion. These inflows were driven by the iShares Bitcoin ETF (IBIT), which added $134 million in assets.
The increase was offset by large outflows from Fidelity’s $38 billion and Grayscale’s GBTC, which lost $17 million. Franklin’s EZBC lost over $7 million in assets.
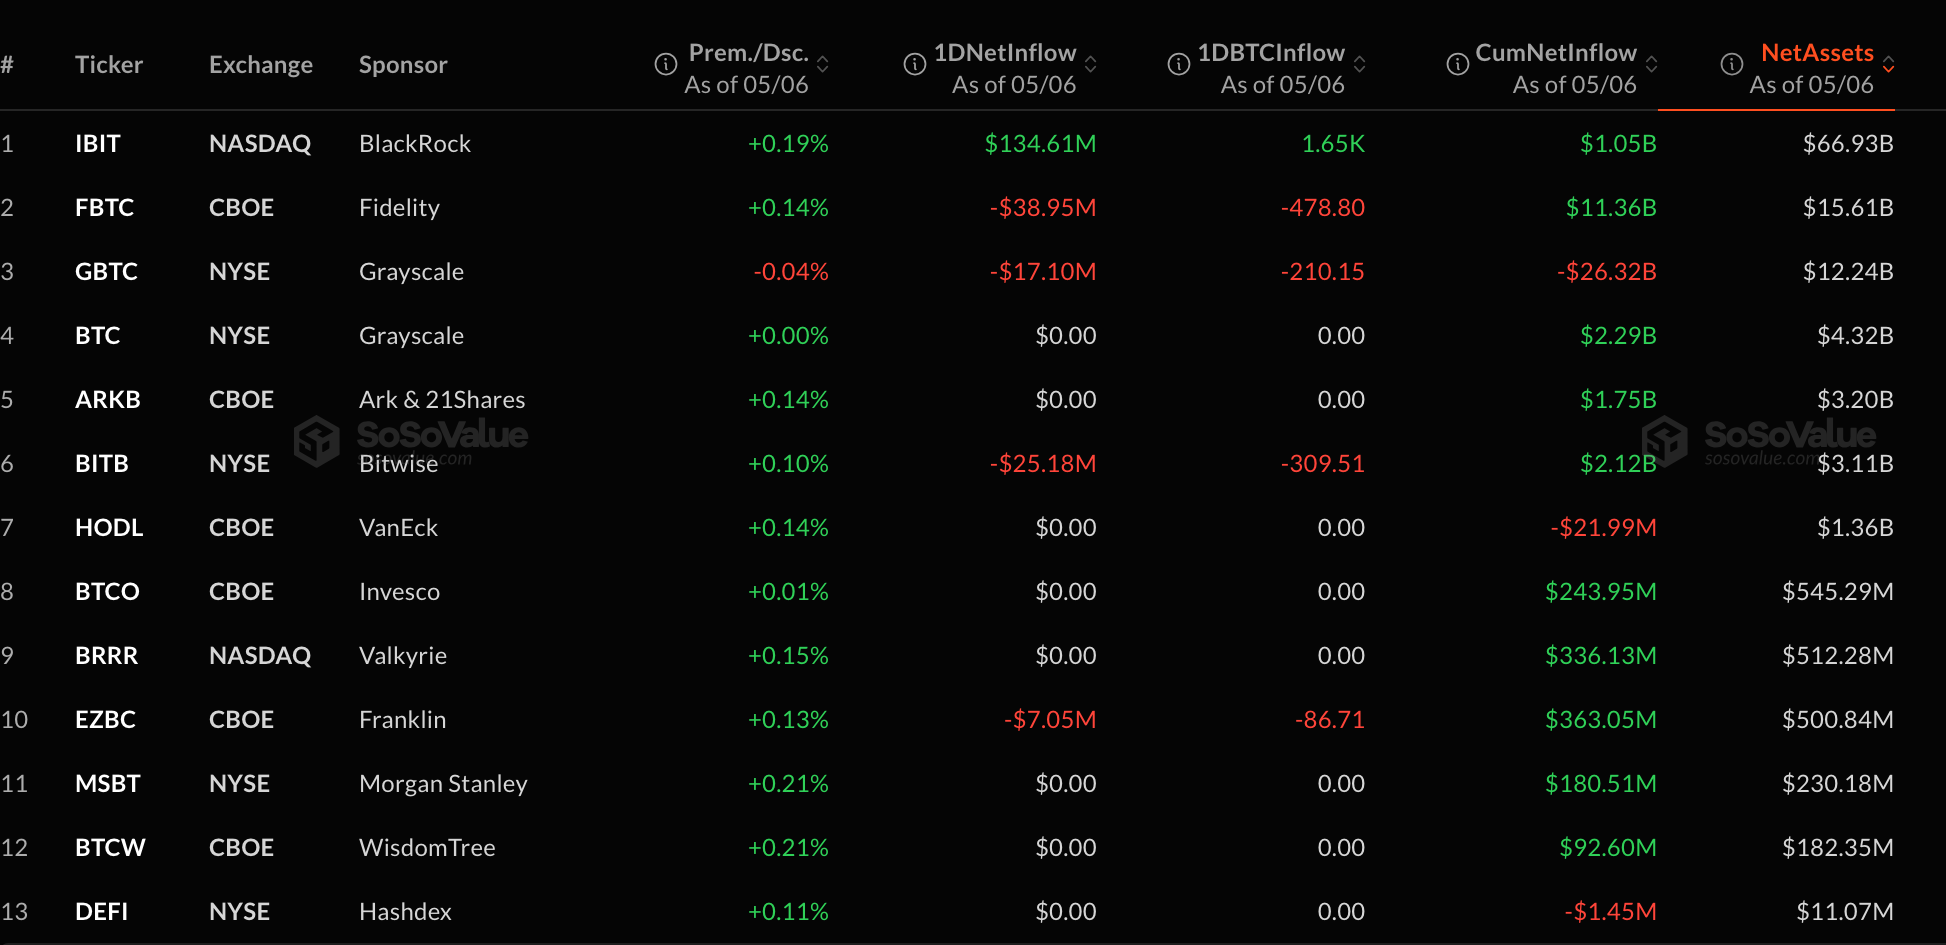 Spot BTC ETF flows | Source: SoSoValue
A single-day inflow does not tell the whole story, as inflows may resume in the coming days. However, if this slowdown continues, chances are that it may affect the performance of Bitcoin.
Potential Catalysts May Keep Supporting BTC Price Rally
On the positive side, some potential catalysts in the crypto industry may help to support the ongoing Bitcoin price rally.
One of them is the fact that Morgan Stanley, a $2 trillion bank, has entered the crypto trading industry. Its main advantage is that it is offering a lower transaction fee, a move that may undercut the incumbents.
The crypto trading service will be made possible through its E-Trade business. It now joins other top companies like Schwab, Fidelity, and SoFi that have launched their trading solutions.
CME, a leading Wall Street firm, announced the launch of a 24-hour crypto trading solution. This new service will debut later this month as a potential market catalyst.
CME expects this new service to bolster its competitiveness against emerging futures market firms like Aster and Hyperliquid. This strategic move targets a stronger position within the rapidly evolving crypto trading landscape.
Bitcoin price has been in an uptrend recently, but some potential risks point to more downside in the near term. This view will be invalidated if the coin jumps above the 200-day Exponential Moving Average (EMA).
The post Bitcoin price Hits 200 EMA Wall as Spot BTC ETF Inflows Fall to $46M appeared first on The Market Periodical.


You May Also Like

XRP Market Now Controlled By Whales? Dominance Reaches 91% On Binance

Vitalik Buterin gets sandwiched by ‘JaredfromSubway’ as Ethereum MEV risks linger