Dogecoin Breakdown Warning: $0.07 Zone Suddenly in Focus
Dogecoin trades near $0.11 as traders watch key resistance and a possible move toward the $0.07 accumulation zone.
Dogecoin traded near $0.1106 on the daily chart as sellers kept pressure on the wider trend.
The latest setup shows DOGE below key Fibonacci resistance, while traders watch the $0.10 to $0.07 area as a possible accumulation zone.
Dogecoin Price Holds Below Key Resistance
Dogecoin remains under the $0.1339 Fibonacci level on the DOGE/USD daily chart. This level marks the 0.786 retracement from the recent range.
The range is measured between the $0.0885 low and the $0.3006 high. Price action below $0.1339 keeps the market inside a weak recovery phase.
DOGE recently bounced from the $0.0885 area and moved toward $0.1106. However, the rebound has not yet changed the wider chart structure.
The daily chart still shows lower highs from the 2025 peak. This pattern suggests that sellers remain active at higher prices.
A daily close above $0.1339 would be the first bullish test. Until then, traders may treat the move as a relief rally.
Bearish Signal Keeps Focus on Lower Levels
The higher time frame chart still points to caution for Dogecoin. Price is trading below major retracement levels, and the trend remains corrective.
The $0.0885 to $0.0950 region is the nearest support area. A breakdown below this zone could open the way toward $0.10 to $0.07.
Many traders now view $0.10 to $0.07 as a lower accumulation zone. This area sits close to prior demand and may attract long-term buyers.
Still, the chart has not confirmed a full reversal. DOGE needs stronger daily closes before buyers can regain control.
The 0.618 retracement sits near $0.1696. The 0.500 retracement is placed near $0.1946. These levels remain distant resistance points.
A move into those zones would require a clear break above $0.1339. Without that move, downside risk remains part of the DOGE price outlook.
Read Also:
RSI and MACD Show Mixed Conditions
Momentum indicators show a mixed view on the Dogecoin daily chart. The RSI is near 64, which shows short-term buyer strength.
However, RSI is moving closer to the overbought area. This could limit the rebound if price reaches resistance soon.
The MACD is also turning positive on the daily chart. The MACD line is above the signal line, and the histogram is slightly green.
This setup shows improving momentum, but it remains modest. Past rallies showed stronger MACD moves before major upside trends developed.
Because of this, traders may still wait for price confirmation. A breakout above resistance would give more support to bullish setups.
The first upside level remains $0.1339. Above that, DOGE could target $0.1696 and $0.1946.
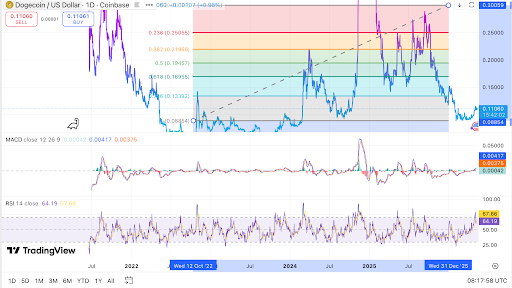 DOGE trades near resistance as momentum improves, chart shows. Source: TradingView
Higher resistance is placed at $0.2196 and $0.2506. The larger range remains near $0.3006.
For now, Dogecoin is trading between recovery and risk. The chart shows short-term strength, yet the higher time frame remains under pressure.
The key level for sellers is $0.0885. The key level for buyers is $0.1339. A break on either side may guide the next DOGE/USD move.
The post Dogecoin Breakdown Warning: $0.07 Zone Suddenly in Focus appeared first on Live Bitcoin News.


You May Also Like

Windish RV Center Expands Denver-Area Inventory with New Lance Travel Trailers

CoreWeave (CRWV) Stock Jumps on Historic $8.5B GPU-Backed Loan — What Investors Need to Know