

How AI Models Are Evaluated for Language Understanding

Table of Links
Abstract and 1. Introduction
- Related work
- Materials and method
3.1 Procedures
3.2 Dataset creation
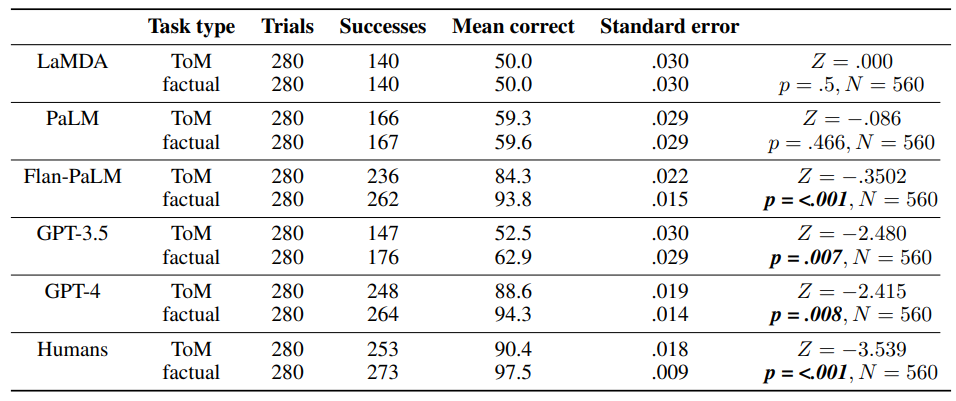
4. Results
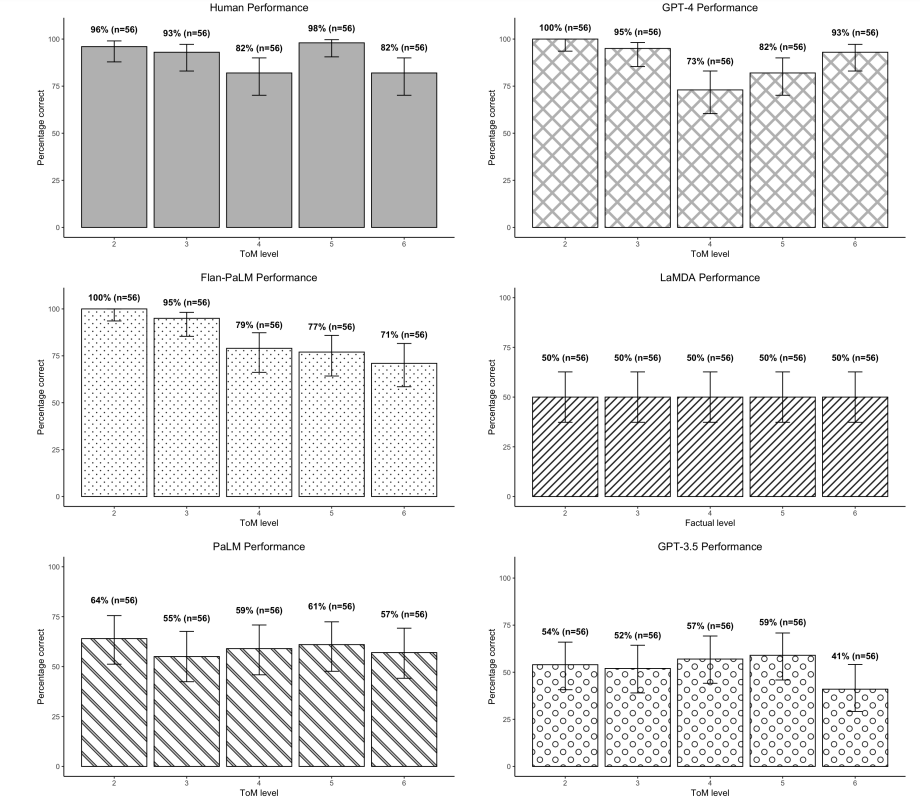
4.1 ToM task performance
4.2 Factual task performance
4.3 Comparing performance on ToM and factual tasks and 4.4 Anchoring effect
5. Discussion
6. Limitations 7. Future research 8. Conclusion, Acknowledgments and Disclosure of Funding, and References
Appendix
A Appendix
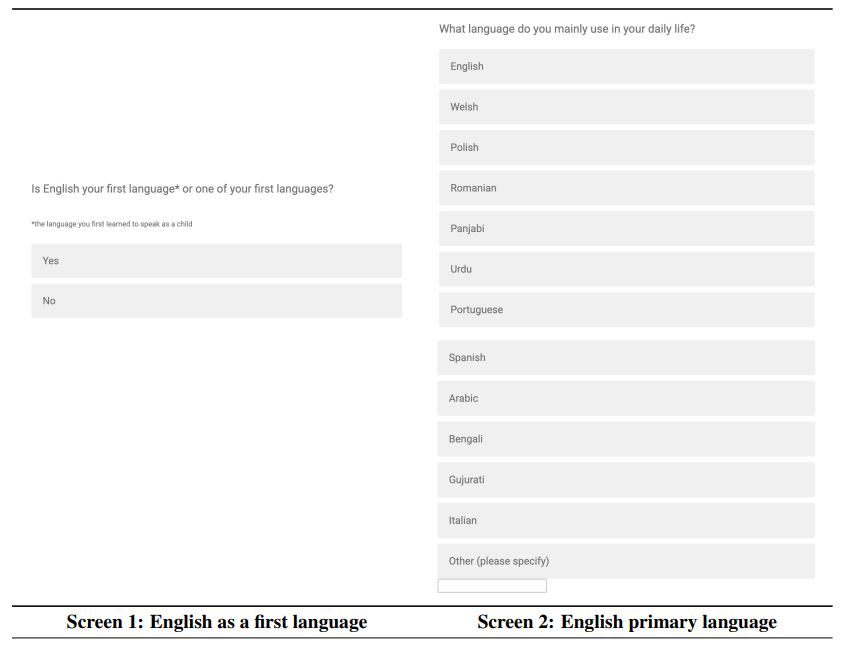
A.1 English language screener
Our screening criteria for human participants were English as a first language and English as the most commonly used language. We did not use the concept or term ‘native speaker’ because it can be exclusionary and tends to conflate the true factor of interest (linguistic proficiency) with other irrelevant factors like socio-cultural identity, age and order or context of acquisition [Cheng et al., 2021]. We wanted participants for whom English was a first language, defined as the language, or one of the languages, that they first learnt as a child. This is because first languages are known to shape one’s understanding of grammar and we wanted to minimise the chance that the grammatical complexity of our statements was a confounding factor in performance. We also wanted English to be the language participants use on a day to day basis, to screen out those who learnt English as a first language but now primarily use another language and may therefore be less fluent in English.
A.2 Human pilot study
We ran a pilot study through Qualtrics to validate the procedure and detect ambiguities, errors, and irregularities in the stimuli based on participant performance and explanations. We ran the unmoderated survey on Qualtrics with 1440 participants, which equates to 10 responses per statement. The median response time for the first 50 participants was one minute, suggesting that they were rushing, so we disabled the ‘Next’ button on the survey for 60 seconds for the remaining 1390 participants to ensure they had time to read the story twice. We retained this timer for the final survey. We analysed participant performance on ToM and factual statements on a story by story basis and identified performance outliers. In total we observed 17 statements on which people performed relatively poorly. We re-examined the statements and used participants’ open-ended responses to identify ambiguities in either the story or the statement that could be responsible for the low performance. We found ambiguity in 15 out of 17 cases, and resolved it by making changes to the wording of 14 statements and 1 story. The remaining two cases of poor performance were a order 4 statement and a order 2 statement, for which open-ended responses suggested that participants had not paid attention. After reviewing both statements we did not make any changes.
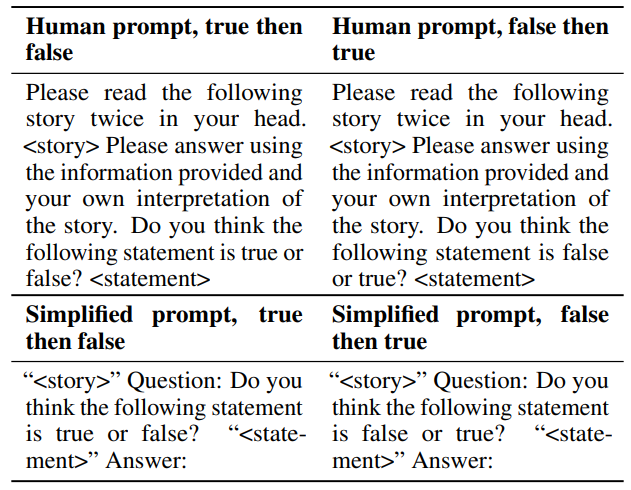
A.3 LLM prompt conditions
Table 3 presents the exact text that LLMs received in each of the 4 conditions we tested.
A.4 Details of the LLMs tested
LaMDA stands for Language models for Dialog Applications, a family of Transformer-based neural models developed by Google, specialised for dialog in English [Thoppilan et al., 2022]. LaMDA
\ 
\ is pre-trained on 1.56T words of public data and web text including 1.12B dialogs from public forum (50% of the dataset), Colossal Clean Crawled Corpus data (12.5%), code documents (12.5%), Wikipedia English articles (12.5%) and a smaller proportion of non-English documents. It is optimised for safety and factual grounding. This study uses a version of LaMDA with 35B parameters without fine tuning.
\ PaLM, which stands for Pathways Language Models, is a larger family of models developed by Google. It relies on the Pathways architecture that enables training of a single model across thousands of accelerator chips more efficiently than LaMDA. We use a version of PaLM with 540B parameters trained with smaller corpus of 780B words from a mixture of social media conversations (50%), filtered webpages (27%), books in English (13%), Code, Wikipedia, and News articles used to train both LaMDA and GLaM [Chowdhery et al., 2023]. We decided to evaluate PaLM’s capabilities as it has been shown to perform better than LaMDA and other large models on Winograd-style tasks, in-context comprehension tasks, common-sense reasoning tasks and natural language inference tasks [Chowdhery et al., 2023].
\ Flan-PaLM is a version of PaLM 540B fine tuned on a collection of over 1.8K natural language tasks phrased in a natural language instruction format including the type of instructions used with human subjects detailed above [Chung et al., 2024]. Fine tuning language models on datasets phrased as instructions has been shown to improve performance when provided with instructions, enabling the model to better understand tasks and reducing the need for few-shot exemplars [Ouyang et al., 2022, Sanh et al., 2021].
\ GPT 3.5 Turbo was developed by OpenAI and released in March 2022. GPT 3.5 Turbo is trained on a large database of text and code the majority of which comes from Common Crawl, WebText2, two
\ 
\ internet-based book collections called ‘Books1’ and ‘Books2’, and from Wikipedia [Brown et al., 2020]. The parameter size of GPT 3.5 Turbo is undisclosed by OpenAI. This study uses the ‘GPT 3.5 Turbo Instruct’ model, which has training data up to September 2021 and a context window of 4096 tokens and is fine-tuned for following instructions [Ouyang et al., 2022].
\ GPT-4 was developed by OpenAI and released in March of 2023 [Achiam et al., 2023]. GPT-4 is multimodal: it was pretrained on both image and text data, can take images and text as input, and can output text. As with GPT-3.5, the size of the model has not been made public, but estimates place it at approximately 1.7T parameters [McGuiness, 2023]. GPT-4 was pre-trained on thirdparty and public data, then underwent RLHF [Achiam et al., 2023]. OpenAI reported significant performance improvements between GPT-3.5 and GPT-4 on a range of professional and academic human benchmarks, factuality and safety tasks, in particular based upon the addition of RLHF.
A.5 LLM procedure
The experimental design needed to be adapted slightly according to the differences between the APIs. When testing the LaMDA, PaLM and Flan-PaLM, the scoring APIs allowed us to send a list of tokens in natural language (maximum four per set) and receive the logprobs for those tokens only, as a subset of the entire vector of logprobs produced for all tokens. We did not need to set any additional parameters in order to retrieve the logprobs.
\ In order to retrieve log probabilities for our candidates from GPT-3.5 and GPT-4 models, we had to first tokenise the candidates using the OpenAI tokenizer, and then send those tokens within the ‘logit bias’ parameter in order to ensure those tokens were in the response. The logit bias has a range of -100 to 100. Applying a negative logit bias to a token forces the LLM to downweight it while applying a positive logit bias to a token forces the LLM to upweight it. As a result, applying a logit bias of 100 to a candidate effectively ensures that it will appear in the output, so we applied a bias of 100 to all of our candidates. We also set the ‘max tokens’ parameter to 1 in order to restrict the GPT-3.5 and GPT-4 outputs to the length of the single tokens we had selected.
\ The methodological differences between the Google and OpenAI models were inescapable given that LLM API development still lacks standardised formats or conventions. However, given that our metric is the relative probability of semantically equivalent tokens for ‘true’ vs semantically equivalent tokens for ‘false’, we do not believe these differences prohibit fair comparison between the performance of the models.
\
 A.6 Additional analyses
A.6.1 Story and prompt conditions
\ According to an independent samples test of proportions, the LLM prompt conditions had no significant effect on the proportion of ToM or factual statements answered correctly by any of the LLMs. LaMDA’s performance on ToM statements in the human prompt condition (M = 50%) was not significantly different from the simplified prompt condition (M = 50%), N = 280, Z = .000, p = 1.000, nor was its performance on factual statements in the human prompt condition (M = 50%) different from its performance in the simplified prompt condition (M = 50%), N = 280, Z = .000, p = 1.000. PaLM’s performance on ToM statements in the human prompt condition (M = 58.6%) was not significantly different from the simplified prompt condition (M = 60%), N = 280, Z = −.243, p = .808, nor was its performance on factual statements in the human prompt condition (M = 57.9%) different from its performance in the simplified prompt condition (M = 61.4%), N = 280, Z = −.609, p = .542. Flan-PaLM’s performance on ToM statements in the human prompt condition (M = 85%) was not significantly different from the simplified prompt condition (M = 83.6%), N = 280, Z = −.328, p = .743, nor was its performance on factual statements in the human prompt condition (M = 94.3%) different from its performance in the simplified prompt condition (M = 92.9%), N = 280, Z = −.487, p = .626. GPT-3.5’s performance on ToM statements in the human prompt condition (M = 53.6%) was not significantly different from the simplified prompt condition (M = 51.4%), N = 280, Z = .359, p = .720, nor was its performance on factual statements in the human prompt condition (M = 62.1%) different from its performance in the simplified prompt condition (M = 63.6%), N = 280, Z = −.247, p = .805. AAnd finally, GPT-4’s performance on ToM statements in the human prompt condition (M = 87.9%) was not significantly different from the simplified prompt condition (M = 89.3%), N = 280, Z = −.376, p = .707, nor was its performance on factual statements in the human prompt condition (M = 94.3%) different from its performance in the simplified prompt condition (M = 94.3%), N = 280, Z = .000, p = 1.000. According to an independent samples test of proportions the story condition had no effect on the proportion of ToM statements answered correctly by humans (‘no story’ condition (M = 88.6%), ‘with story’ condition (M = 92.1%), N = 280, Z = −1.012, p = .311) or factual statements answered correctly (‘no story’ condition (M = 95.7%), ‘with story’ condition (M = 99.3%), N = 280, Z = −1.914, p = .056).
\ 
\ 
\
:::info Authors:
(1) Winnie Street, Google Research;
(2) John Oliver Siy, Google Research;
(3) Geoff Keeling, Google Research;
(4) Adrien Baranes, Google DeepMind;
(5) Benjamin Barnett, Google Research;
(6) Michael Mckibben, Applied Physics Lab, Johns Hopkins University;
(7) Tatenda Kanyere, Work done at Google Research via Harvey Nash;
(8) Alison Lentz, Google Research;
(9) Blaise Aguera y Arcas, Google Research;
(10) Robin I. M. Dunbar, Department of Experimental Psychology, University of Oxford istreet@google.com.
:::
:::info This paper is available on arxiv under CC BY 4.0 license.
:::
\
You May Also Like

X money beta expands with 6% yield and cashback in beta

Crucial US Stock Market Update: What Wednesday’s Mixed Close Reveals
