

BTC Stalls at Channel Resistance as the $77K Danger Zone Lights Up
Bitcoin hit the upper trend channel boundary and reversed. Liquidation magnets at $77K now pose the biggest downside risk on the 7-day timeframe. Not financial advice.
BTC hit the upper boundary of its trend channel and turned back. The rejection was clean. That part, traders already knew was coming.
What the Bitcoin liquidation heatmap is now showing is the messier part of the picture.
According to More Crypto Online on X, the seven-day liquidation magnet map puts BTC sitting right between two opposing pull zones. The upside targets are $83K to $84K, then $88K. Below current price, the stops cluster at $78K, $77K, and $72K. The $77K zone carries the largest downside concentration on that timeframe.
Source:Morecryptoonl
“BTC sits between two strong magnets,” More Crypto Online said. “The cluster at $77K is the largest downside risk zone on this timeframe.”
When the Ceiling Holds, the Floor Gets Interesting
The rejection itself came with some structure. More Trading Online, posting on X, noted that Bitcoin had been turned away from the upper boundary of the trend channel. A micro support zone sits between $79,932 and $80,458. Holding that shelf matters more now than it did 48 hours ago.
A confirmed break below that range opens a wider corrective move. The wave (2) scenario, More Trading Online, outlined targets $76,527 as the key support level beneath. That puts it uncomfortably close to the $77K liquidation cluster flagged in the heatmap data.

Source: moretradingonl
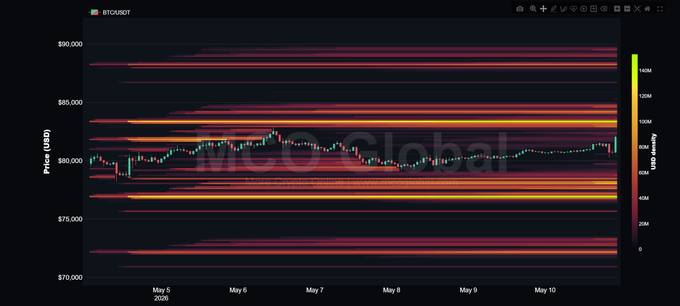
The MCO Global liquidity chart shared alongside the analysis tells its own story. Dense bands of yellow and orange liquidity sit parked between $76,000 and $78,000. That is not a soft landing zone. Price moving into that area would almost certainly accelerate.
$80K Micro Support Is the Line Right Now
The 15-minute Elliott Wave count from More Trading Online’s chart shows a completed wave at the trend channel boundary. Price action is now at a decision point. Wave (2) corrections at this degree can run deep, and $76,527 represents the 78.6% retracement level on the structure.
The Bitcoin heatmap has previously shown how price gravitates toward dense liquidity clusters before any sustained directional move. The current setup is not different in that respect.
Upside magnets at $83K to $84K remain intact. Getting there requires holding $79,932 first. That zone has not been tested hard yet.
Disclaimer: This article is based on technical analysis from cited sources and does not constitute financial or investment advice.
The post BTC Stalls at Channel Resistance as the $77K Danger Zone Lights Up appeared first on Live Bitcoin News.


You May Also Like

Metaplanet Stock Passes MARA to Become Third-Largest BTC Holder — Stock Slips Anyway

Why Businesses Need Professional Machine Design and Development Services


