

Kaspa Price Diverges: Miners Capitulate While Whales Accumulate
The Kaspa price slipped 1.46% over the past 24 hours to trade near $0.0379, underperforming a broader crypto market that remained mostly flat. Bitcoin lost only 0.34% during the same period, showing that KAS faced extra weakness from fading buyer demand and declining volume.
Daily trading activity dropped nearly 24% to $24.45 million, with the token also trading below its 7-day and 30-day moving averages near $0.0382–$0.0383. Even with the weaker price action, network activity continues expanding quickly.
Kaspa just passed 2.1 billion total transactions. That happened only a few days after it hit 2 billion. The reason is its BlockDAG design, which processes ten blocks per second. Some analysts also called Kaspa (KAS) one of the best altcoins under one dollar right now. They pointed to its proof-of-work system that can scale and the fact that more regular people are noticing it when money moves between different parts of the crypto market.
Whales Keep Buying Kaspa Even as Miners Turn Bearish
Data shared by Kaspa Daily showed a major divergence between different groups inside the Kaspa market. Wallets holding more than 10 million KAS increased their balances by 6.71% over the past week and roughly 7% over the month, bringing combined whale holdings to 6.68 billion KAS.
Also, exchange reserves continued declining, with three-day net flows remaining negative. That combination often points to accumulation because large holders move tokens away from exchanges instead of preparing them for sale.
The realized capitalization also remained flat near $608 million even after the Kaspa price climbed earlier this month. That matters because realized cap tracks the aggregate cost basis of coins moving on-chain.
A flat reading during price appreciation can mean buyers are absorbing distribution without aggressively chasing higher prices. Metrics like MVRV at 1.83 and NUPL at 0.452 also show the market is neither overheated nor deeply undervalued, leaving room for a larger directional move later.
Miners, however, are showing the opposite behavior. Hashrate dropped 3.3% below the 30-day average, Hash Ribbons turned bearish with the 30-day moving average falling under the 60-day line, and the Puell Multiple dropped to 0.64. Those metrics usually point to miner stress and lower profitability conditions.
Open interest also went up to $50.7 million. That’s 12.4% higher than the usual seven-day average. Funding rates rose to 0.9205% every eight hours. That tells us people are betting hard on the price going up, even though miners are having a tougher time. That kind of setup can break easily if the market gets shaky.
Related Kaspa News: ChatGPT Predicts Kaspa (KAS) Price if the CLARITY Act Fails
Kaspa (KAS) Exchange Flows Hint at Changing Market Behavior
Another update from Kaspa Daily showed exchange flow behavior changing after several consecutive sessions dominated by withdrawals. Bybit recorded the largest outflows at nearly 6 million KAS, though inflows started appearing across Gate.io, MEXC, and ChangeNOW, with each exchange receiving roughly 2 to 3 million KAS. Bitget, Uphold, and Bitvavo also flipped net positive during the session.
The interesting part is that inflows were spread across multiple exchanges instead of concentrating on a single venue. That mirrors the earlier pattern seen during the broader outflow period and may point to traders repositioning across the market instead of panic selling into one exchange. Broad inflows after extended withdrawals can sometimes mark the early stages of increased trading activity or rising short-term volatility.
Even so, the balance between inflows and outflows still leans slightly constructive because the larger multi-day trend remains dominated by exchange withdrawals. If that trend resumes, traders may interpret it as continued accumulation from larger holders despite weaker short-term price action.
Here’s What the Kaspa Chart Is Showing
We looked at the chart. The short-term picture shows the rally has lost steam. Earlier this week, Kaspa shot up past $0.041. But the price couldn’t stay there and fell back toward $0.037. That level is now the nearest support. Sellers jumped in hard near the local top, and over the last few days, each high has been lower than the one before it.
Momentum indicators also weakened sharply. The RSI dropped toward 47 after spending time near overbought territory above 70 earlier in the rally.
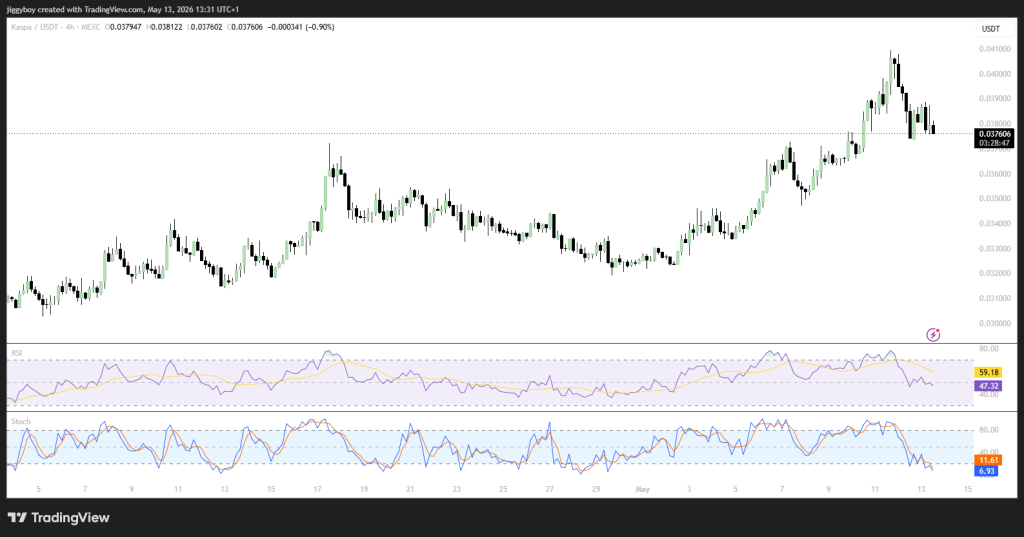 Source: TradingView.com
Even the stochastic oscillator dropped below 20. That means momentum faded fast after the rejection near $0.041. Trading volume is also falling, which tells us buyers aren’t putting much weight behind this pullback.
Even with the correction, the broader trend has not fully broken down yet. The Kaspa price still trades well above the April lows near $0.031 and continues printing a sequence of higher lows across the broader timeframe.
If buyers defend the $0.037 zone, traders may start looking for another attempt toward the recent highs near $0.041. A breakdown below support could expose the $0.034 to $0.035 area next.
Where Could the Kaspa Price Go Next?
Bearish Path
The reasons to be careful are miner weakness, slowing price action, and too many people betting with borrowed money. If the Bitcoin price drops and those borrowing costs stay high, Kaspa could fall back to $0.034 or even test the April low near $0.031. Low trading volume also means prices can drop faster without much warning.
Bullish Path
Big investors keep buying more Kaspa. You can see exchange wallets drying up. That means they’re moving their coins off to hold, not trade. Even with miners struggling right now, these whales don’t seem worried. They’ve done this before. Sometimes that quiet accumulation is what happens right before a big move up. If buyers push past $0.041 again, you might see people start aiming for $0.045 or $0.050.
Most likely case
But what will probably happen is the KAS price just drifts sideways between $0.034 and $0.041 for a while. The market shot up fast and needs time to rest. No rush. No fireworks. Just a slow back and forth until the next real move comes.
Frequently Asked Questions

The Kaspa price fell harder than the broader crypto market, even though Bitcoin only dipped slightly. Trading volume also dropped nearly 24% to $24.45 million, showing there was not much strong buying interest during the session. KAS also stayed below its short-term moving averages near $0.0382–$0.0383, which added more pressure to the price action.
A move to $1 is possible, but it would require a major increase in adoption, market value, and overall demand for the network. Kaspa’s fast BlockDAG architecture and growing on-chain activity give it stronger fundamentals than many smaller altcoins. Still, reaching $1 would likely depend on a powerful crypto bull market and continued ecosystem growth over multiple years.
Technical indicators still lean slightly bearish, with overall market sentiment around 52% bearish and the Fear & Greed Index sitting at 47, which points to neutral conditions. Over the last 30 days, Kaspa recorded 15 green days with volatility near 3%, showing the market has remained relatively stable despite short-term weakness. Traders appear cautious for now, especially after the recent rejection near the $0.041 resistance area.
Subscribe to our YouTube channel for daily crypto updates, market insights, and expert analysis.
The post Kaspa Price Diverges: Miners Capitulate While Whales Accumulate appeared first on CaptainAltcoin.


You May Also Like

PMI-ACP Exam Preparation: How to Use a Simulator and Practice Questions Effectively

EUR/GBP Exchange Rate Surges as Bank of England Rate Hike Expectations Intensify – Market Analysis


