Gold Price Forecast: XAU is Up 39% in a Year, and It’s Still the Discount Option as Money Printing Rages
Key highlights:
- The gold price has risen about 42% in a year, tracking closely with expanding global money supply since late 2023.
- Macro charts show gold in a long-term rising channel, with liquidity trends still supporting the broader structure.
- Gold stays tightly linked to global liquidity, with money supply expansion still driving long-term price action.
The gold price has climbed about 39% over the past year, and a lot of traders still say the move makes sense when you look at what’s happening with global money supply.
A chart shared by Rand Group has been making rounds in macro circles because it shows a strong link between the gold price and global liquidity growth over the past couple of years.
Both have been moving almost in sync since late 2023, tracking total liquidity measured in trillions of dollars against gold’s price action. For many investors, that relationship is one of the reasons the gold price still looks like it has room to run, even after pulling back from its 2025 highs.
Gold price and liquidity have been moving together
Back in late 2023, the gold price was sitting near $1,900. Around that time, global liquidity started expanding again at a faster pace, and that’s when the bigger move began.
As money supply growth picked up through 2024 and into 2025, the gold price followed the same direction. By early 2025, gold had already moved above $3,500, and later in the cycle it reached close to $5,595 at the peak.
The same chart also shows year-over-year money supply changes through blue bars under the main price line. Every time liquidity expanded strongly, gold followed with another leg higher.
Even after the recent pullback, the gold price is still trading around $4,700 to $5,000 on that chart. That’s still far above where the breakout started in 2023 and early 2024. This is why many macro traders still see gold as being in a broader bullish cycle.
The gold price correction has not broken the bigger structure
The gold price cooled off after a very strong run in 2025, but the broader structure still looks intact on higher timeframes.
On the chart shared by RandGroup, gold is still moving inside a long-term rising channel that has guided the entire trend over the past two years. The recent drop looks more like a reset after an extended rally, not a full trend reversal.
Traders are paying close attention to the $4,000 to $4,400 zone. As long as the gold price stays above that area, many market participants still treat the broader uptrend as valid. Liquidity growth has also slowed compared to the strongest phase seen in 2025. That slowdown helps explain why gold has paused after such a fast and extended rally.
Even with that slowdown, global money supply is still expanding overall, and the upward channel on the chart remains intact. That’s one of the reasons many traders are not ready to turn bearish yet.
Why gold is still seen as a hedge
A big part of the gold price story still comes back to inflation, debt levels, and monetary policy. Many investors use gold as a hedge against currency debasement. When governments expand debt and central banks increase liquidity, fiat currencies can lose purchasing power over time.
Gold, with its fixed supply, is often used as protection in that kind of environment. That idea has become stronger in recent years as global debt has climbed and central banks have repeatedly stepped in with supportive monetary policies.
According to CoinCodex’s 1-month gold price prediction, the price could move to around $4,311.71, which is below current levels and indicates that some analysts still expect a short-term pullback despite ongoing support from global liquidity expansion and macro demand for hard assets.


You May Also Like

BNB slips below $590 as Trump threatens to strike Iranian power plants
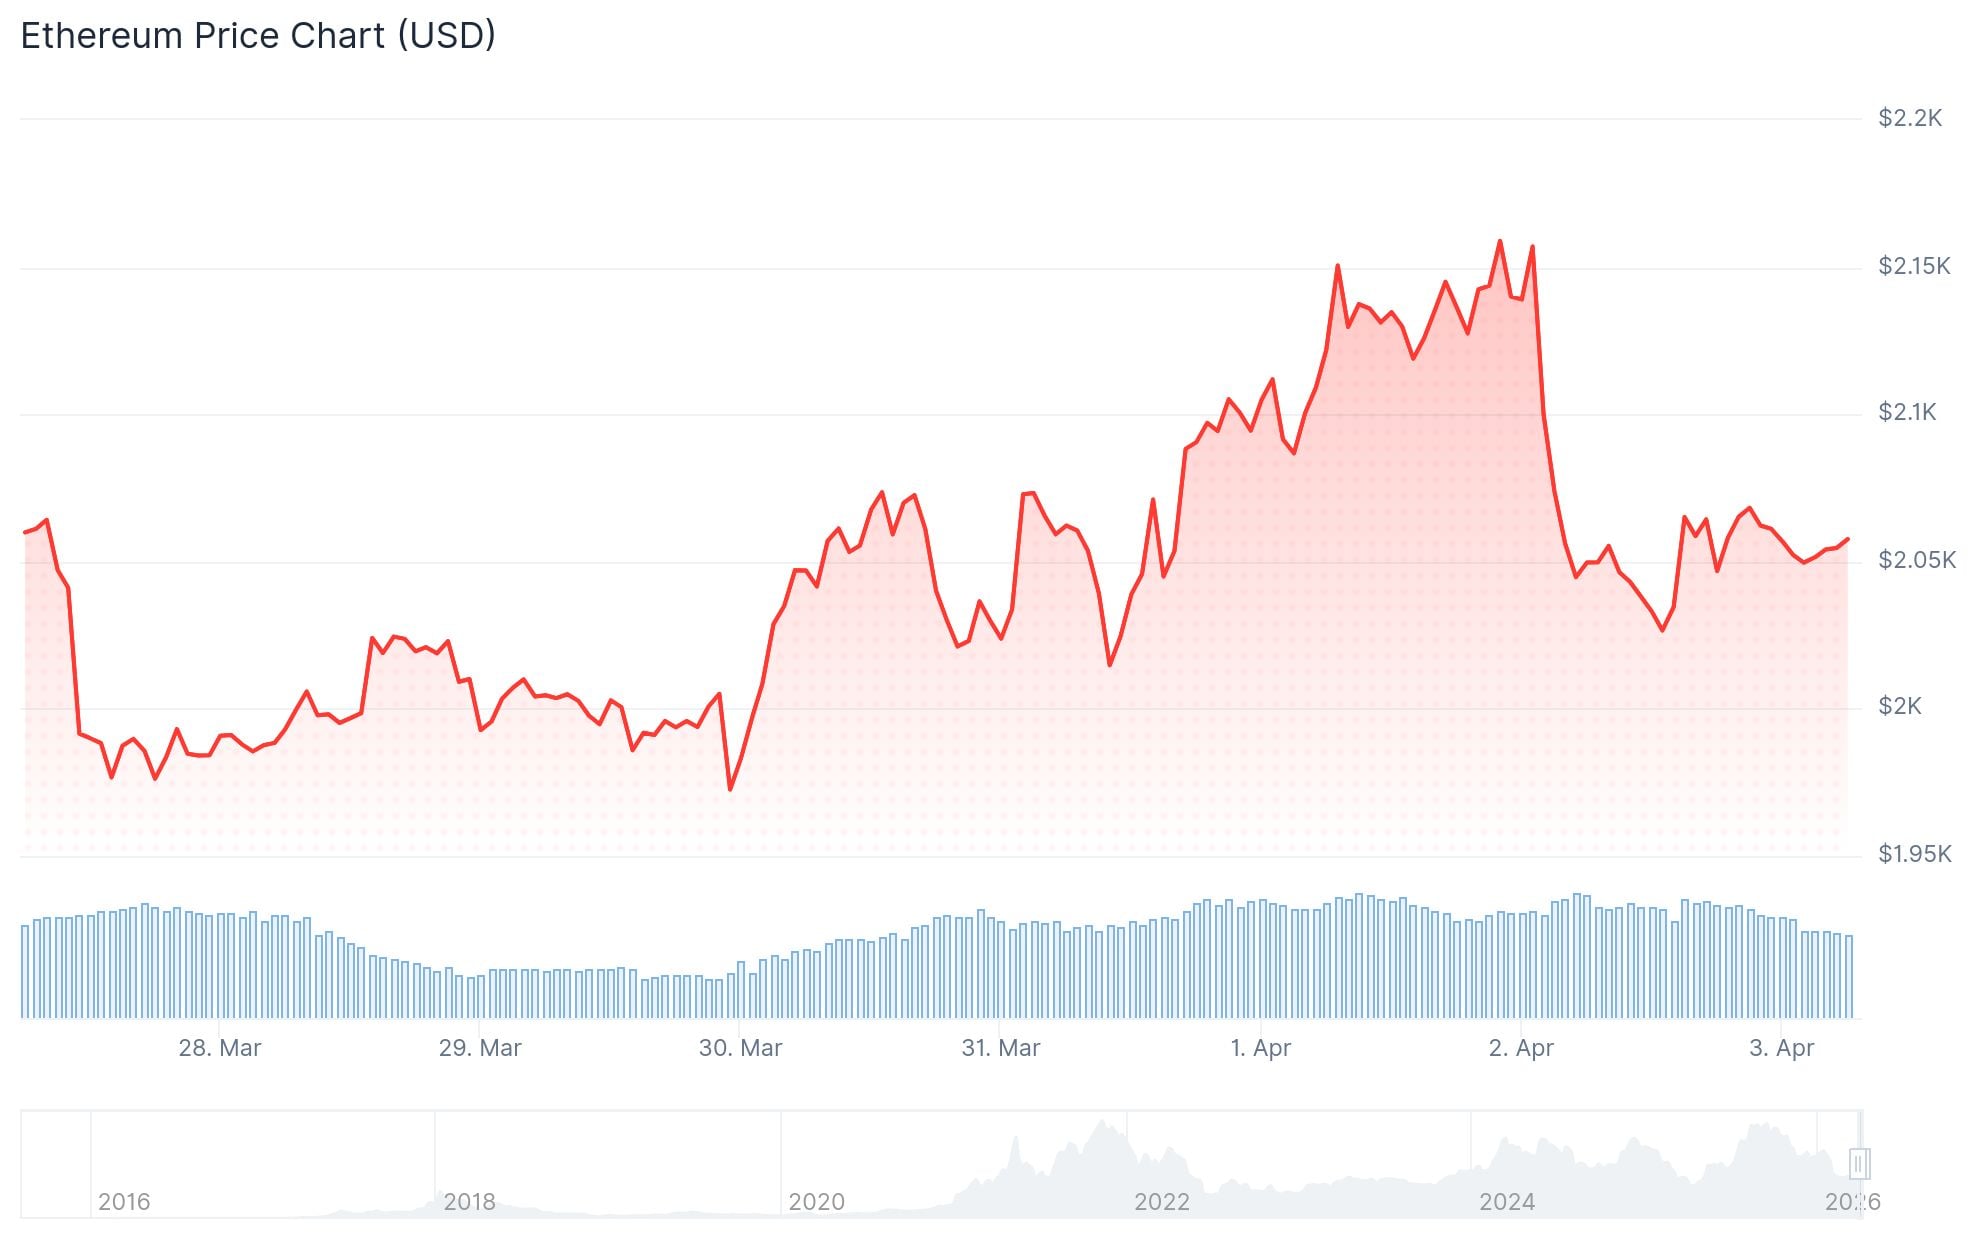
Ethereum (ETH) Price: Bulls Must Reclaim $2,150 Soon or Risk New Lows