

Mediobanca slips at 6.25 as daily charts turn bearish

Mediobanca (MB) is pinned at 6.25 with momentum slipping on the higher timeframe. The daily setup leans bearish despite a nominally neutral regime, while intraday readings look stretched to the downside. That mix argues for caution: pressure remains lower, yet a short-term bounce cannot be ruled out.
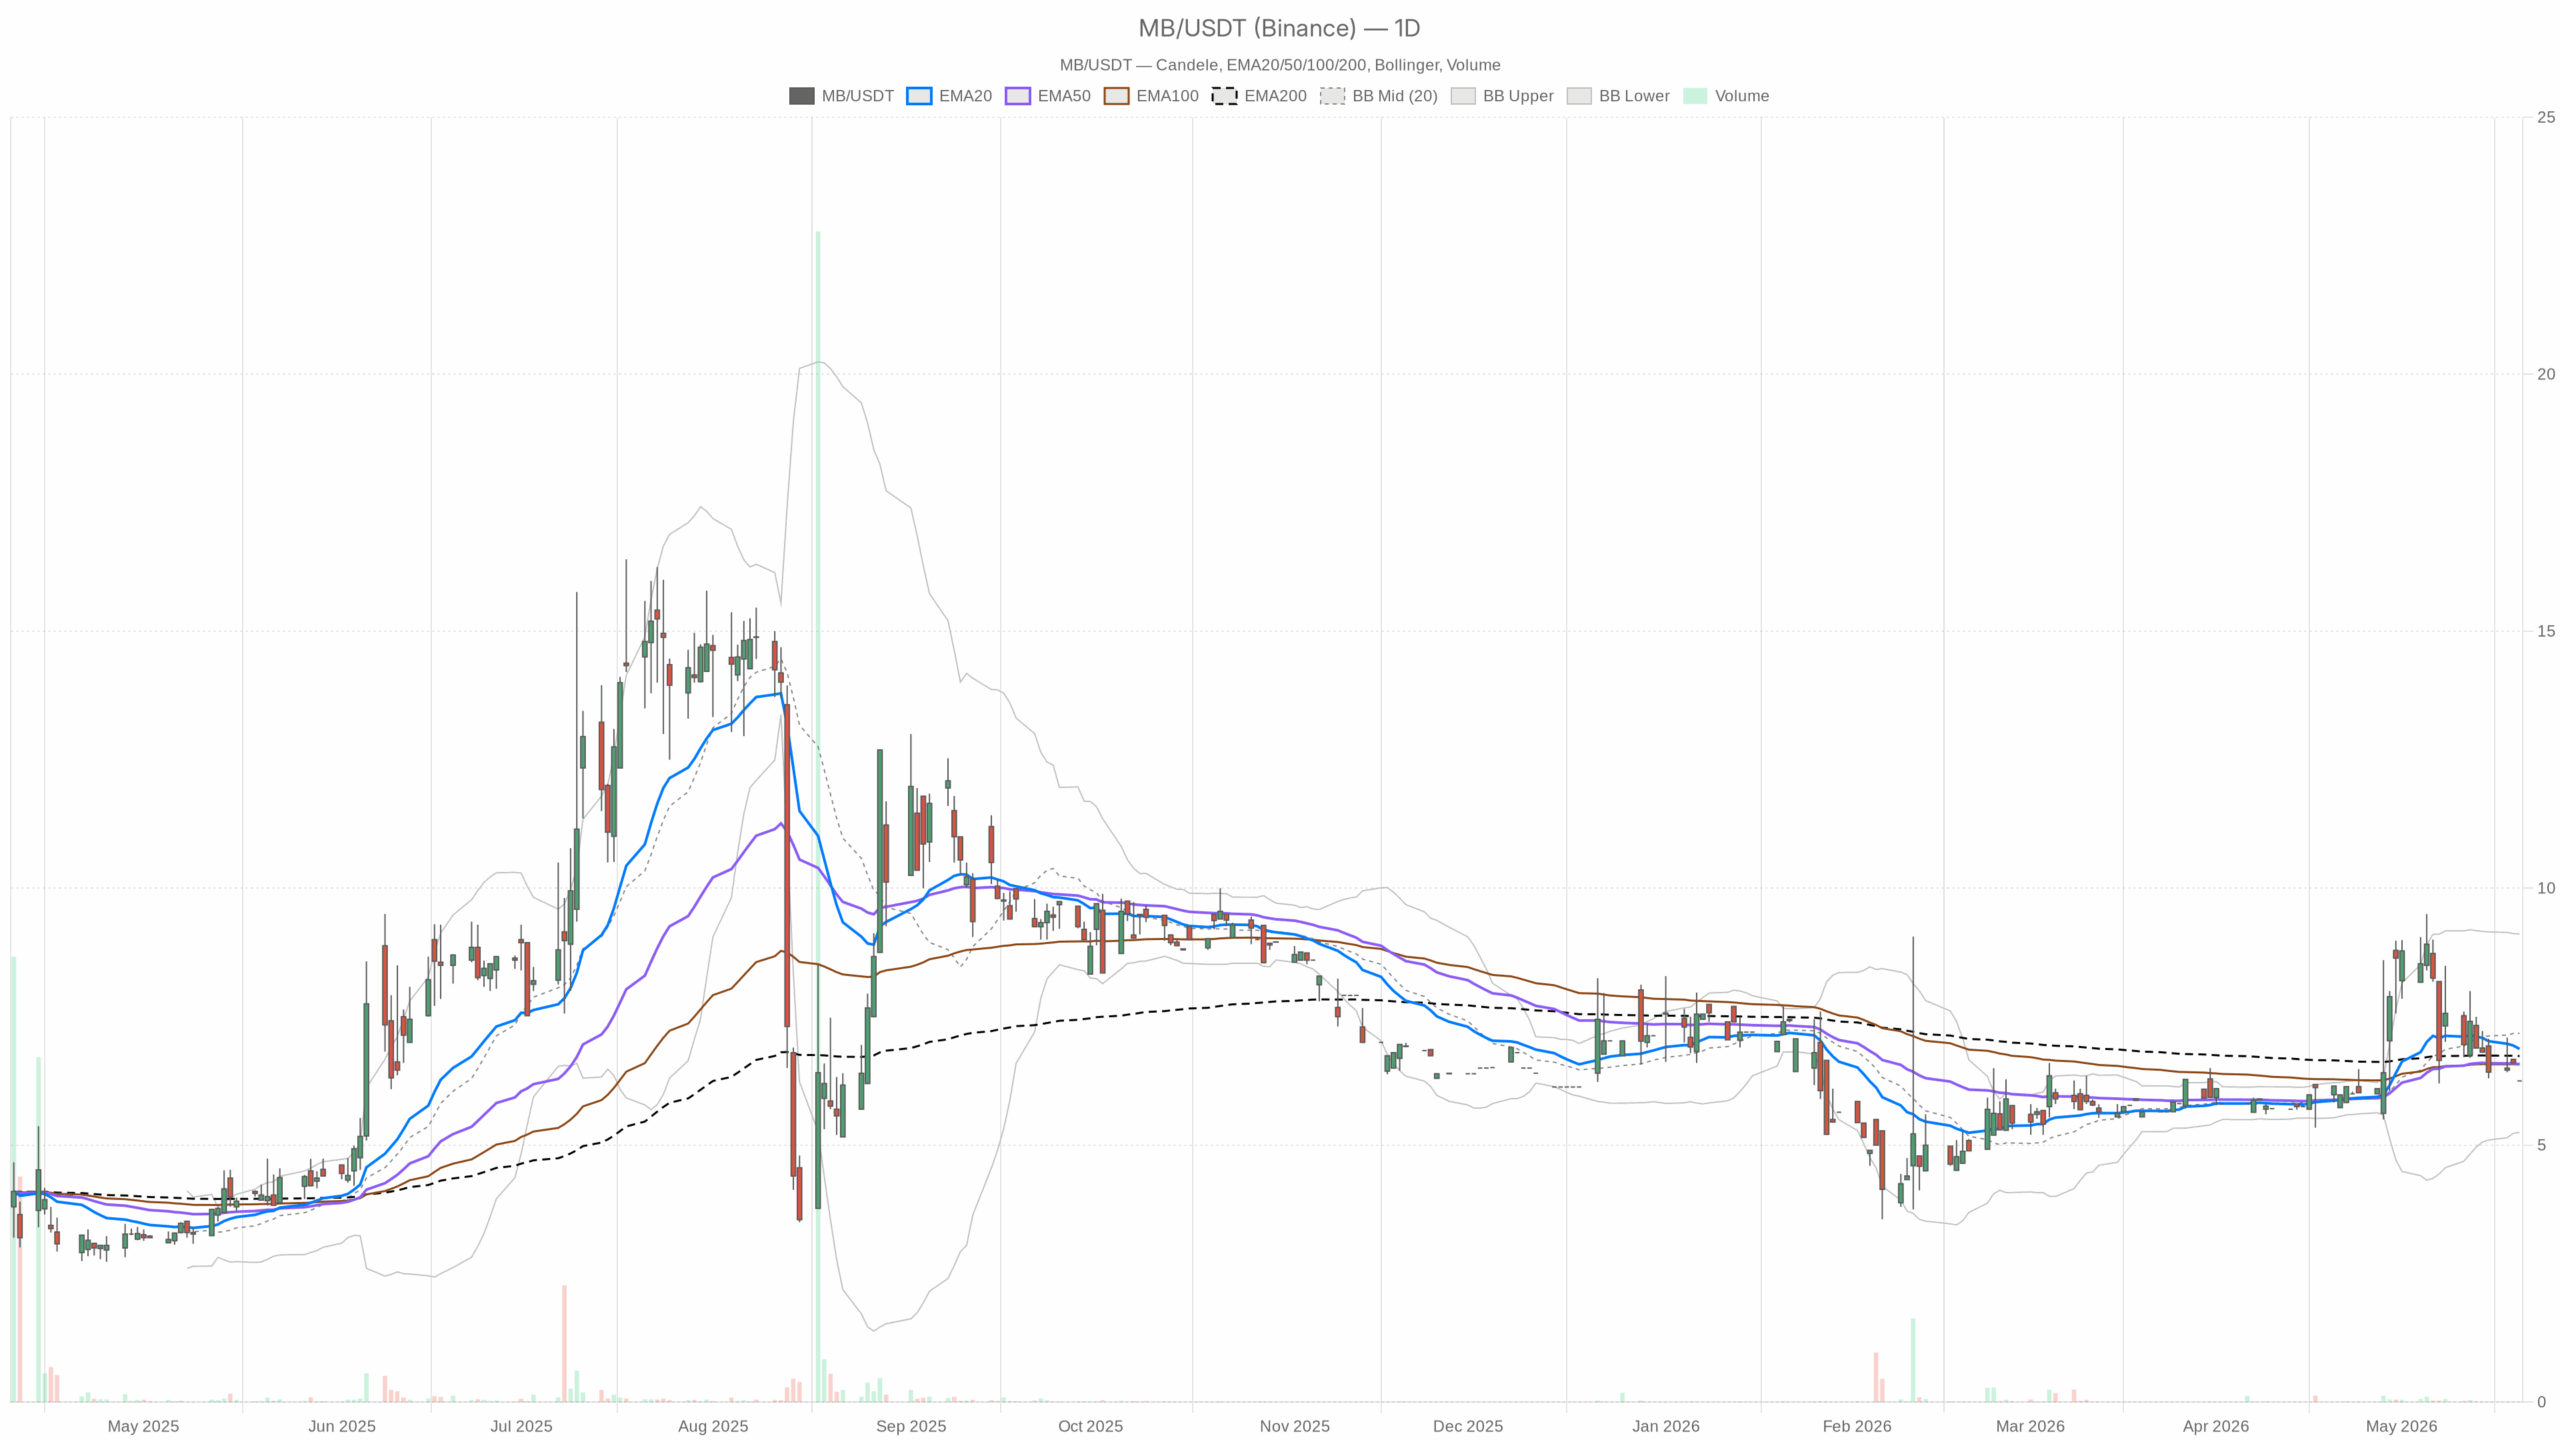 MB — daily chart with candlesticks, EMA20/EMA50 and volume.
Daily technical outlook for Mediobanca (MB)
Trend and momentum
On the daily chart, MB trades below all key moving averages — EMA20 6.87, EMA50 6.58, and EMA200 6.73. Trading under these slopes signals sellers have the initiative on the primary timeframe. Daily RSI14 prints 44.29, below balance and tilting negative, though not washed out. Meanwhile, the daily MACD shows line 0.04 vs signal 0.24 with a histogram of -0.20, keeping bearish momentum in place.
Volatility and pivots
Daily Bollinger Bands show a midpoint at 7.18 with an upper band at 9.11 and a lower band at 5.25. Price is below the mid-line, leaving Mediobanca in the lower half of the envelope and consistent with downside pressure. Daily ATR14 is 0.93, indicating elevated recent volatility even if today looks static. Notably, the daily pivot complex sits at 6.25 for PP/R1/S1, a flat grid that offers little directional edge.
Intraday Mediobanca signals: 1H trend weak
Hourly trend and momentum
On the 1H timeframe, EMA20 6.87, EMA50 7.16, and EMA200 6.83 all sit above price, so the intraday trend structure points lower and confirms the daily bias. Hourly RSI14 stands at 34.55, weak and nearing oversold territory. In addition, the hourly MACD shows line -0.18 vs signal -0.15 with a histogram of -0.03, implying downside momentum without acceleration.
Bands, ATR, and pivots
The hourly Bollinger midpoint is 6.87 with a lower band at 6.46, while price is 6.25. Trading below the lower band flags a stretched move that often precedes mean reversion. Meanwhile, hourly ATR14 is 0.24, so intraday ranges remain meaningful relative to the recent backdrop. The hourly pivot also sits at 6.25, compressing reference levels and raising the significance of breaks once price starts to move.
15-minute setup: bearish micro-trend
Micro-trend and oscillators
On the 15‑minute chart, EMA20 6.83, EMA50 7.01, and EMA200 7.32 are all above price, leaving the micro‑trend bearish and rallies facing layered resistance. The 15m RSI14 is 29.25, an oversold reading that raises the risk of a reflex bounce.
The 15m MACD shows line -0.11 vs signal -0.06 with a histogram of -0.04, so bearish momentum persists but could fade if a bounce develops. The 15m Bollinger midpoint is 6.83 with a lower band at 6.43, while price is 6.25. Trading well below the lower band signals a stretched, late‑stage intraday move. Still, 15m ATR14 at 0.14 keeps micro volatility active, making timing important. The 15m regime remains marked bearish, favoring selling into strength rather than chasing lows.
Scenarios for MB
Therefore, the main scenario for Mediobanca is bearish on the daily timeframe. Evidence comes from price below all daily EMAs, a sub‑50 RSI, and a negative MACD histogram. The primary bias points lower until momentum stabilizes and the moving averages are reclaimed.
On the other hand, a constructive path would start with price rebounding back inside the hourly Bollinger set, i.e., reclaiming 6.46. A close back inside the band would indicate downside exhaustion.
Follow‑through would then need a push above the daily EMA50 at 6.58 and the EMA200 at 6.73. Recovering these averages would shift the balance away from sellers. A further close above the daily EMA20 at 6.87 and the Bollinger midpoint at 7.18 would strengthen a trend‑reversal case, moving MB into the upper half of the daily envelope.
In contrast, the bearish continuation case would be validated by failure to reclaim 6.46 on the hourly and persistent prints below the lower intraday bands. Sustained downside outside the bands often accompanies trending selloffs.
With price already under all key EMAs, continued weakness keeps the daily lower Bollinger at 5.25 as the next volatility boundary. It is not a target, but it frames the downside risk zone. A daily RSI roll further under 40 and a still‑negative MACD histogram would add confirmation, arguing against early bottom‑fishing.
At the same time, a timeframe conflict persists. The daily bias is bearish, but the 1H and 15m charts look oversold beneath their lower bands. This setup favors tactical bounces against a still‑weak primary trend, complicating entries and risk control.
Overall, positioning around 6.25 remains delicate given thin prints and elevated ATRs across frames. Volatility can expand quickly once price breaks away from the static pivot cluster. Until Mediobanca can reclaim key daily moving averages, risk skews to the downside even if intraday relief rallies emerge.


You May Also Like

CoreWeave (CRWV) Stock Surges 12% on $8.5B GPU-Backed Financing Deal — Here’s the Full Picture

Kaia Expands Institutional Adoption with Elliptic Compliance Support

USD/CHF Slips as Renewed US-Iran Talks Curb Safe-Haven Demand


