-
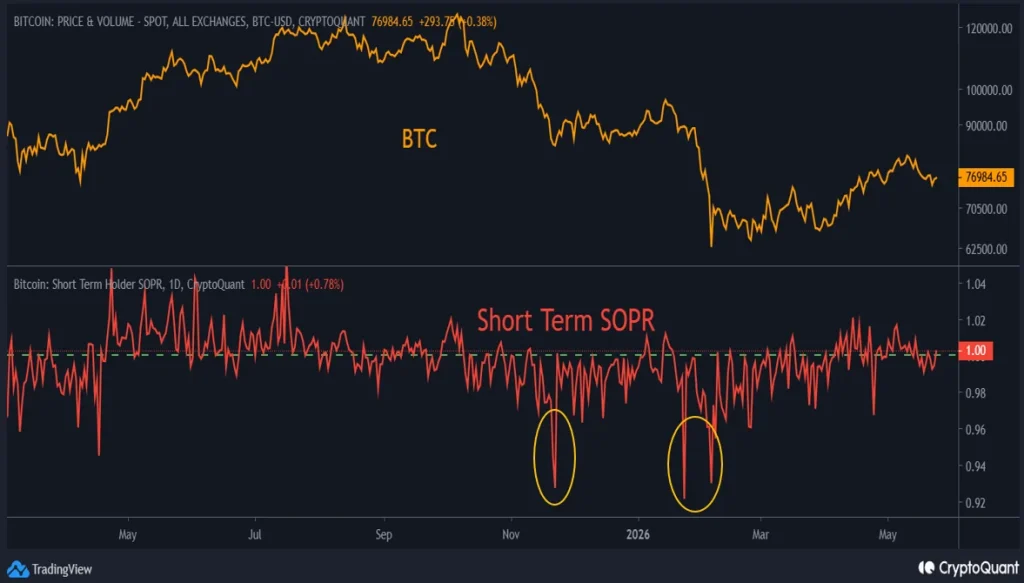
SOPR metric hovering at 1.00 signals weak hand capitulation hasn't occurred yet, suggesting further downside before macro bottom formation.
-
Rising wedge pattern on daily charts indicates bearish reversal risk with breakdown target near $60,730 support zone.
In the current crypto market everyone’s praying for that crazy upside moonshot, but the charts? They’re telling a different bedtime story. Especially, the Bitcoin price analysis clearly reveals we’re dancing on a knife’s edge, and the music’s about to stop. The structure looks fragile, the momentum’s fading, and the bulls are running out of runway fast.
Short-Term Holders Are Sweating Bullets
Just recently analysts Crypto Dan shared that the SOPR metric is flatlining right at 1.00. That’s break-even city, folks. Short-term holders aren’t booking profits; they’re just praying to get out alive without bleeding red. Historically, we need those nasty dips below 0.94 to really wash out the weak hands and reset the market properly. Right now? It’s a complacency party, and nobody’s leaving until the bouncer shows up.
Bitcoin Price Action Suggests The Wedge Isn’t Your Friend
Looking at the daily structure. We’ve got a textbook rising wedge squeezing price tighter. Meanwhile, BTC Price is hugging the upper boundary while the 200-day EMA looms overhead like a guillotine. Volume’s is anemic. The FRVP shows the wedge’s lower border support around $71600 is aligning with it.
Bitcoin Price Analysis: The $60K Trap Awaits
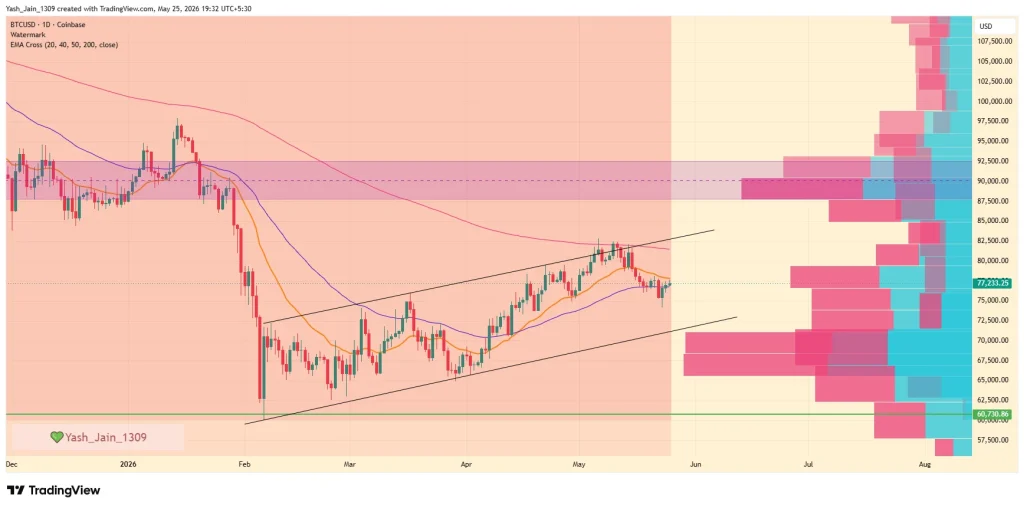
Moreover, on the daily chart, If this rising wedge breaks and let’s be real, they usually do then in that case we’re not looking at a gentle correction. We’re talking a liquidity vacuum sucking price straight toward $60,730. That’s where the real volume sits. That’s where the capitulation happens. The SOPR will finally flush deep red, weak hands will panic, and only then does the macro bottom form. This Bitcoin price analysis suggests the pain isn’t over yet and one must avoid catching this falling knife.