

Robert Kiyosaki Makes Shocking Silver and Gold Price Predictions for 2026
Robert Kiyosaki’s latest comments on X have stirred attention in the metals space. He floated the idea of gold moving toward $100,000 and silver reaching $200 per ounce, compared to current levels of roughly $4,500 for gold and $75 for silver. He also tied the outlook to an “imminent crash,” arguing that investors who position early in metals could benefit if volatility picks up.
PeerMetals echoed the same figures and linked the discussion to rising industrial use for silver and ongoing central bank demand for gold. With that in the background, the real question becomes how the gold price and silver price are actually behaving right now on the charts.
Gold price: Cooling Phase After a Strong Run
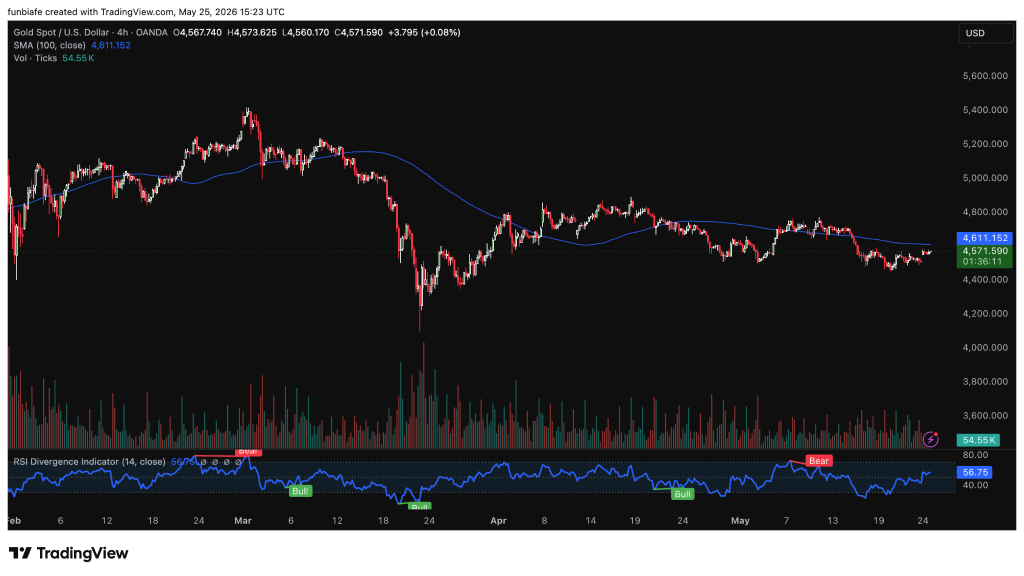
We had a look at the gold chart and what stands out first is a cooling phase after a strong move earlier in 2026 that pushed the market above $5,600 before momentum faded. From then on, the gold price entered a consolidation pattern, trading between about $4,450 and $4,800.
As it stands now, gold is currently being traded around $4,570 and trading under the SMA 100 of $4,611. This acts as an immediate resistance level for gold prices. Unless it rises above that level, gold will continue to face immediate bearish pressure.
 Source: TradingView
For the support side, gold is currently supported in the range of $4,500-$4,560, while further supports exist near $4,450. For the resistance, there are sell orders at $4,650, while resistance exists close to $4,800, where previous rallies peaked.
The momentum of gold is quite neutral now, where its RSI is reading near 56.75. In addition, its volume has been fairly stable near 54.55K. This generally signals that gold is consolidating after making a substantial move. For the gold price, the key trigger is simple: reclaim $4,611 for strength to return, or lose $4,500 for a deeper slide toward $4,300–$4,400.
Silver Price: Range-Bound With Tight Pressure Zones
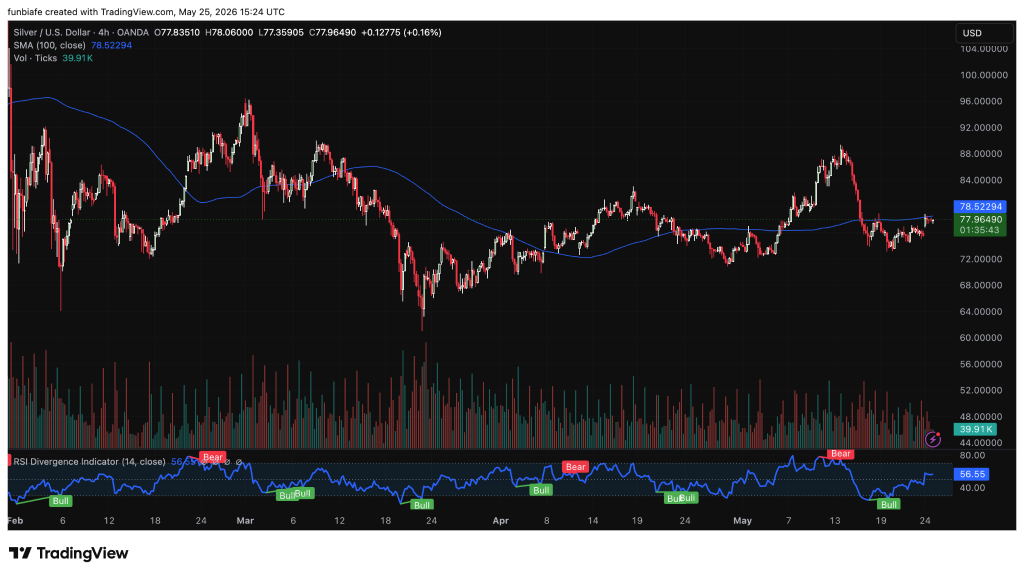
We also reviewed silver, and the structure looks similar but more compressed. Silver is trending within a large trading range of $72 to $88 following its earlier bullish move in 2026 that faded out.
Support sits at $76.50–$77, with a stronger base near $74–$75. If that lower area breaks, the next zone opens toward $70–$72. On the upside, a move above $80 would be needed before silver can challenge $82–$85 again.
 Source: TradingView
RSI is near 56.55, which keeps silver in neutral territory. Earlier signals showed buyers stepping in at lower levels, but follow-through has been limited. Volume at 39.91K shows active trading, but not strong directional conviction yet. For the silver price, the structure is still range-bound. A break above $78.52 would be the first real sign of upside control, while losing $74 would shift attention lower.
Where Kiyosaki’s view meets the charts
Kiyosaki’s projections of $100,000 gold and $200 silver assume a major macro shift and a strong multi-year demand shock. The current charts don’t show anything close to that kind of expansion yet.
Both the gold price and silver price are moving inside consolidation structures after earlier rallies. Gold is cooling under resistance, and silver is locked in a wide range with no breakout confirmed.
For now, the gap between bold forecasts and actual price behavior is wide. Until either metal breaks key resistance levels with strong momentum, the market is still in a wait-and-see phase rather than a trend that supports extreme targets.
FAQs

Not always. While they often show correlation, gold is more driven by macroeconomic uncertainty, while silver is heavily tied to industrial demand.
Yes. Gold is widely viewed as a store of value during inflation, currency weakness, or geopolitical stress.
Subscribe to our YouTube channel for daily crypto updates, market insights, and expert analysis.
The post Robert Kiyosaki Makes Shocking Silver and Gold Price Predictions for 2026 appeared first on CaptainAltcoin.


You May Also Like
Exclusive interview with Smokey The Bera, co-founder of Berachain: How the innovative PoL public chain solves the liquidity problem and may be launched in a few months

Stakestone (STO) Soars: Token Surpasses $1.14 After Stunning 367% Rally
People can't stop skewering dubious Trump claim that war is '95 percent done'



