

The Bond Market Is Flashing a Warning — Is a Stock Market Selloff Coming?
TLDR
- Treasury yields have surged across the board since the U.S.-Iran war began in late February, with the 30-year bond hitting its highest level in 19 years.
- CPI inflation jumped to 3.8% in April, with forecasts pointing to 6.7% by Q2 as energy prices push up broader costs.
- The Fed is now expected to hike rates by January 2027, a reversal from earlier expectations of two rate cuts this year.
- Since 1999, the S&P 500 has dropped every time the Fed started a new rate-hike cycle, with an average decline of 7%.
- Stock markets rose on hopes of a U.S.-Iran peace deal, but bond markets stayed cautious ahead of key inflation and GDP data due Thursday.
The U.S.-Iran war has sent inflation rising, pushed Treasury yields to multi-year highs, and shifted expectations for the Federal Reserve from cutting rates to hiking them. Here is what is happening and why it matters for investors.
Treasury Yields Are Climbing Across the Board
When the war began in late February, oil prices surged after Iran closed the Strait of Hormuz, a key route for global oil shipments. That pushed energy costs higher, which fed into broader prices across the economy.
CPI inflation came in at 3.8% in April. That is the highest reading since 2023. The Federal Reserve Bank of Cleveland projects it could reach 6.7% by the second quarter.
As inflation expectations rose, investors began selling Treasury bonds. When bond prices fall, yields rise. The 2-year Treasury yield is up 75 basis points since the war began. The 30-year bond now pays over 5%, its highest level in 19 years.
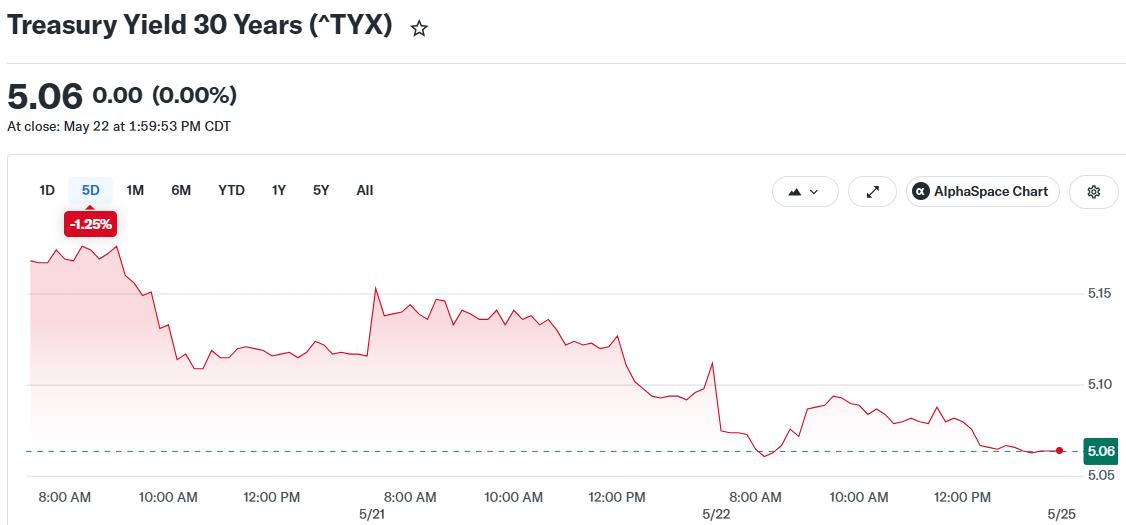 Treasury Yield 30 Years (^TYX)
Markets started the year expecting the Fed to cut rates at least twice. Now, according to CME Group’s FedWatch tool, the next move is expected to be a rate hike, as early as January 2027.
Rate Hikes Have Historically Hit Stocks Hard
Higher rates make borrowing more expensive for businesses, which can slow investment and cut into profits. They also weigh on consumer spending for big-ticket items that require financing.
Since 1999, the Fed has launched four rate-hike cycles. The S&P 500 fell every single time in the three months that followed. The average drop was 7%, with declines ranging from 1% to 17%.
The S&P 500 is up about 9% for the year so far, supported by a strong earnings season. But some analysts warn the rally may be masking deeper risks.
Peace Hopes Lift Stocks, but Bond Markets Stay Wary
On Tuesday, stocks rallied on reports that U.S.-Iran peace talks were nearing completion. The Nasdaq climbed around 300 points, led by gains in Nvidia, Intel, and Micron Technology. The S&P 500 was called nearly 50 points higher at the open.
Oil prices moved sharply. Brent crude jumped over 3% to $96.43 a barrel in early trading, though it remains about 8.6% below Friday’s close.
Secretary of State Marco Rubio said the talks were in their final stages but could take “a few more days.” At the same time, Iran’s Revolutionary Guard claimed it fired on a U.S. aircraft that entered Iranian airspace, raising doubts about the timeline.
Bond markets did not share the optimism. The 10-year Treasury held above 4.5%. The 30-year stayed above 5%. Traders remain cautious ahead of April inflation data and first-quarter GDP figures due Thursday.
Key data this week includes new home sales figures and weekly jobless claims, in addition to Thursday’s inflation and GDP reports. Those numbers could set the tone for how markets close out the week.
The post The Bond Market Is Flashing a Warning — Is a Stock Market Selloff Coming? appeared first on CoinCentral.


You May Also Like

Cango Inc. Completes $65M Investment and Secures $10M Convertible Note Financing

The Digital Identity Crisis and How BrandSnag Helps Creators Reclaim Their Online Presence

Metaplanet buys 5,075 Bitcoin in Q1 to become 3rd-largest treasury



