

MRVL stock heads into earnings overbought, but bulls still lead

MRVL stock remains in a dominant daily uptrend into earnings, but it is stretched. The bias is bullish, yet overbought readings and a close above the daily Bollinger Band argue for two-way risk in the near term.
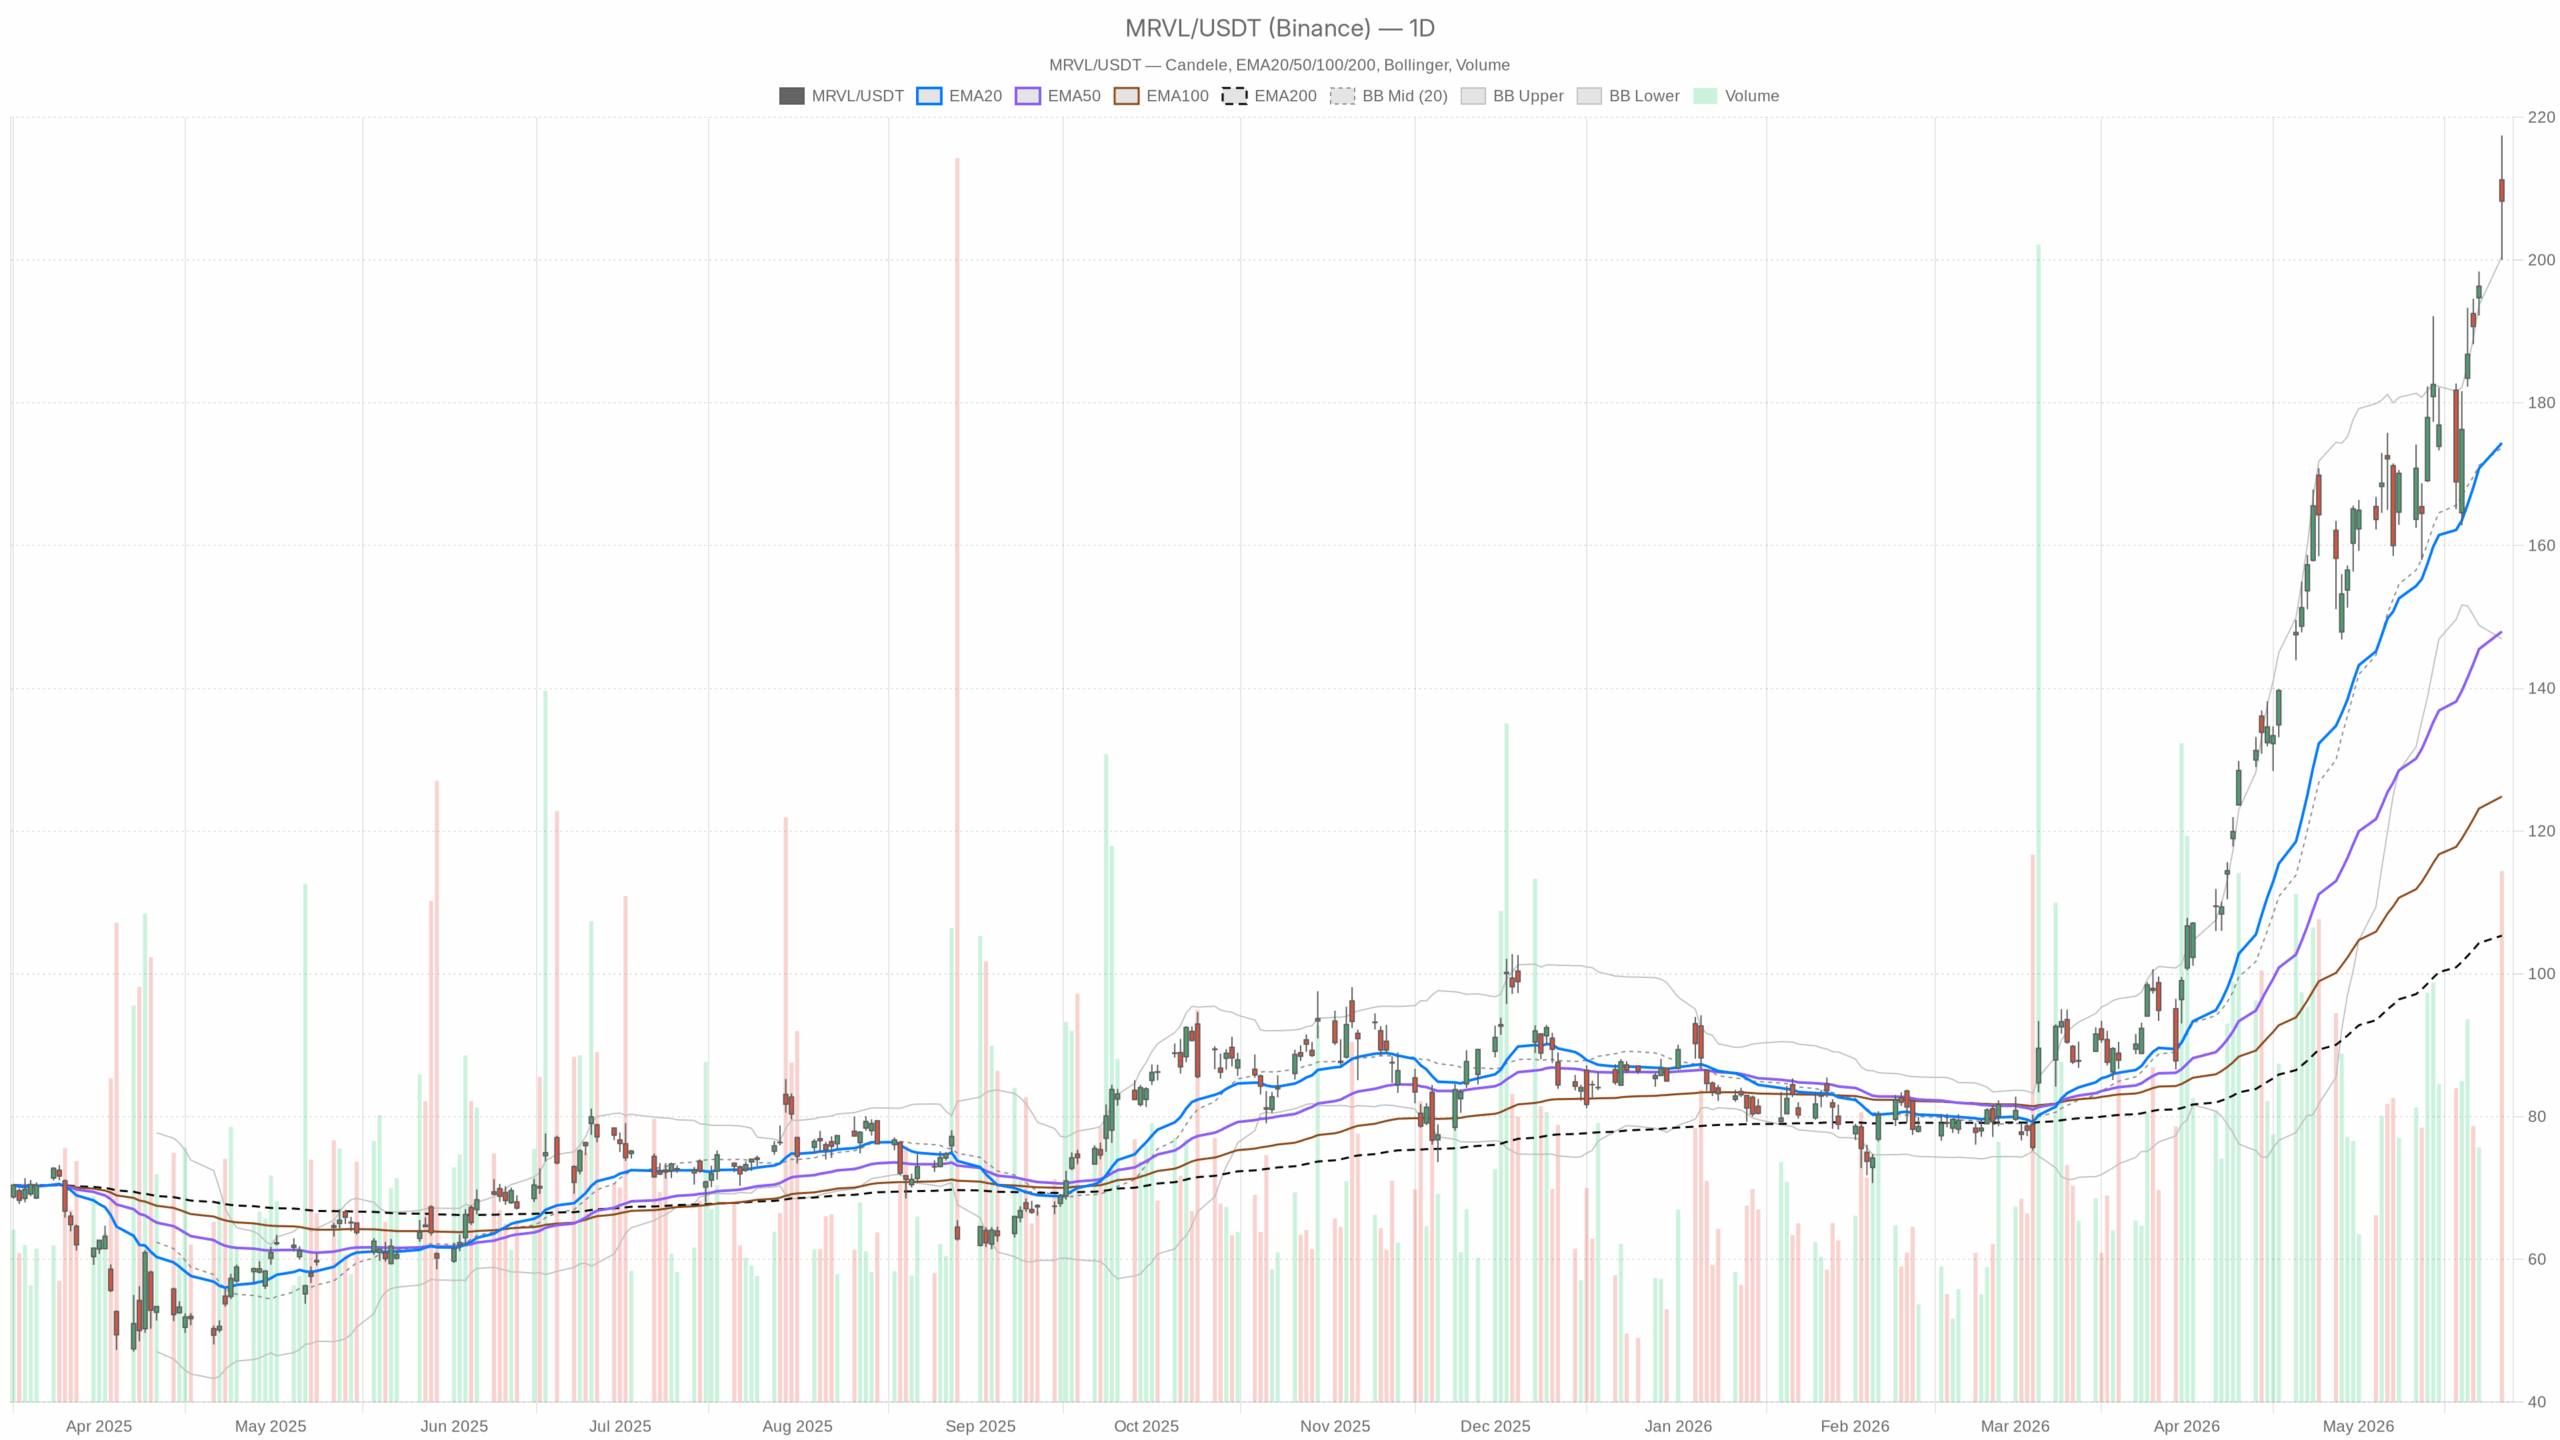 MRVL — daily chart with candlesticks, EMA20/EMA50 and volume.
MRVL stock daily trend: bullish, but extended into earnings
Trend alignment and momentum
Notably, the daily regime is bullish. Price sits at $208.26 versus a 20-day EMA of $174.38, 50-day EMA of $147.96, and 200-day EMA of $105.35. That alignment shows a strong, established trend with buyers in control. Meanwhile, daily RSI is 75.08. That is overbought, signaling strength but also vulnerability to shakeouts. In addition, the daily MACD line is above its signal with a positive histogram of 1.36. That confirms upside momentum is still active, albeit cooling slightly.
Volatility, bands, and key daily levels
Furthermore, price closed above the daily Bollinger upper band at $200.51. That reflects powerful demand but also an extended condition versus recent volatility. Finally, ATR(14) on the daily chart is 13.68. That implies wider session ranges and elevated volatility. On levels, the daily pivot is $208.58 with R1 at $217.13 and S1 at $199.72. A close just below the pivot marks $208–209 as a near-term battleground.
Earnings backdrop and news flow
Moreover, news flow supports the advance ahead of results. Several analysts raised MRVL price targets, and a Micron-led rally highlighted tight AI-driven chip supply. That backdrop helps sentiment into Wednesday’s earnings release, but it also concentrates event risk in the next 24–48 hours.
H1 technicals: uptrend intact, decision zone near $210
On the 1-hour chart, the trend corroborates the daily view. The 20/50/200 EMAs at $199.04, $189.46, and $165.77 are stacked upward. That confirms an intact uptrend on the intermediate timeframe.
At the same time, H1 RSI is 73.56. That is strong but near levels where momentum often pauses. The H1 MACD shows a positive histogram of 0.62. That indicates buyers still have the upper hand intraday.
Additionally, MRVL stock sits near the H1 pivot at $208.47, with R1 at $209.62 and S1 at $207.08. That places price in a tight decision zone just below $210. Meanwhile, H1 Bollinger Bands show price in the upper half (mid $198.27, upper $211.76). That positioning reflects persistent dip buying. H1 ATR at 4.45 points to meaningful intraday swings.
15-minute momentum cooling below resistance
However, the 15-minute context shows momentum cooling into resistance. The 15m RSI is 61.23, which is constructive but no longer hot. The 15m MACD histogram has slipped slightly negative at -0.20, flagging a short-term loss of punch. In addition, MRVL stock is hovering around the 15m pivot at $208.72 with R1 at $209.37 and S1 at $207.58. Meanwhile, the 15m Bollinger mid sits at $206.25, leaving room for a shallow mean reversion if buyers step back.
Scenarios for MRVL stock into earnings
Therefore, the main scenario remains bullish on the daily timeframe. Holding the $207–209 zone (cluster of H1/15m pivots and nearby supports) and clearing $209.62 (H1 R1) would reopen $211–212 and then the daily R1 near $217.13. The EMA stack across all timeframes backs dip buys within trend. Here, RSI being overbought is a feature of strong tapes, not an automatic sell.
On the other hand, the bullish case would weaken if MRVL loses $207 intraday and fails to reclaim the pivot area around $208–209. A sustained slip could then target $206–209 on the 15m context and, if pressure builds, the psychologically important $200 area. Notably, the daily S1 is $199.72 and the daily Bollinger upper band is $200.51. That confluence would be a logical first mean-reversion zone if sellers gain traction.
In contrast, any spike toward $217 without consolidation would carry “blow-off” risk given the daily close above the upper band and RSI near 75. That does not negate the trend, but it raises the probability of sharp, fast pullbacks.
Bottom line
Overall, positioning into earnings favors a bullish bias with tactical flexibility. Volatility is elevated, and ATR signals wider ranges. Respect the $207–209 pivot zone for near-term control, and expect swift moves as headlines hit. The trend is up, but the tape is stretched, so timing matters.


You May Also Like

JIC Ventures backs Webout as it takes real-time video personalisation platform to the US

Exclusive interview with Smokey The Bera, co-founder of Berachain: How the innovative PoL public chain solves the liquidity problem and may be launched in a few months

Monster Beverage (MNST) Stock Hits 52-Week High After Strong Q1 Earnings



