

Verizon stock tests $48 resistance as daily uptrend stays intact

Verizon stock maintains a constructive daily uptrend, but intraday momentum is fading near the 48 handle. The base case remains mildly bullish; however, bulls need acceptance above 48.01–48.20 to unlock further upside.
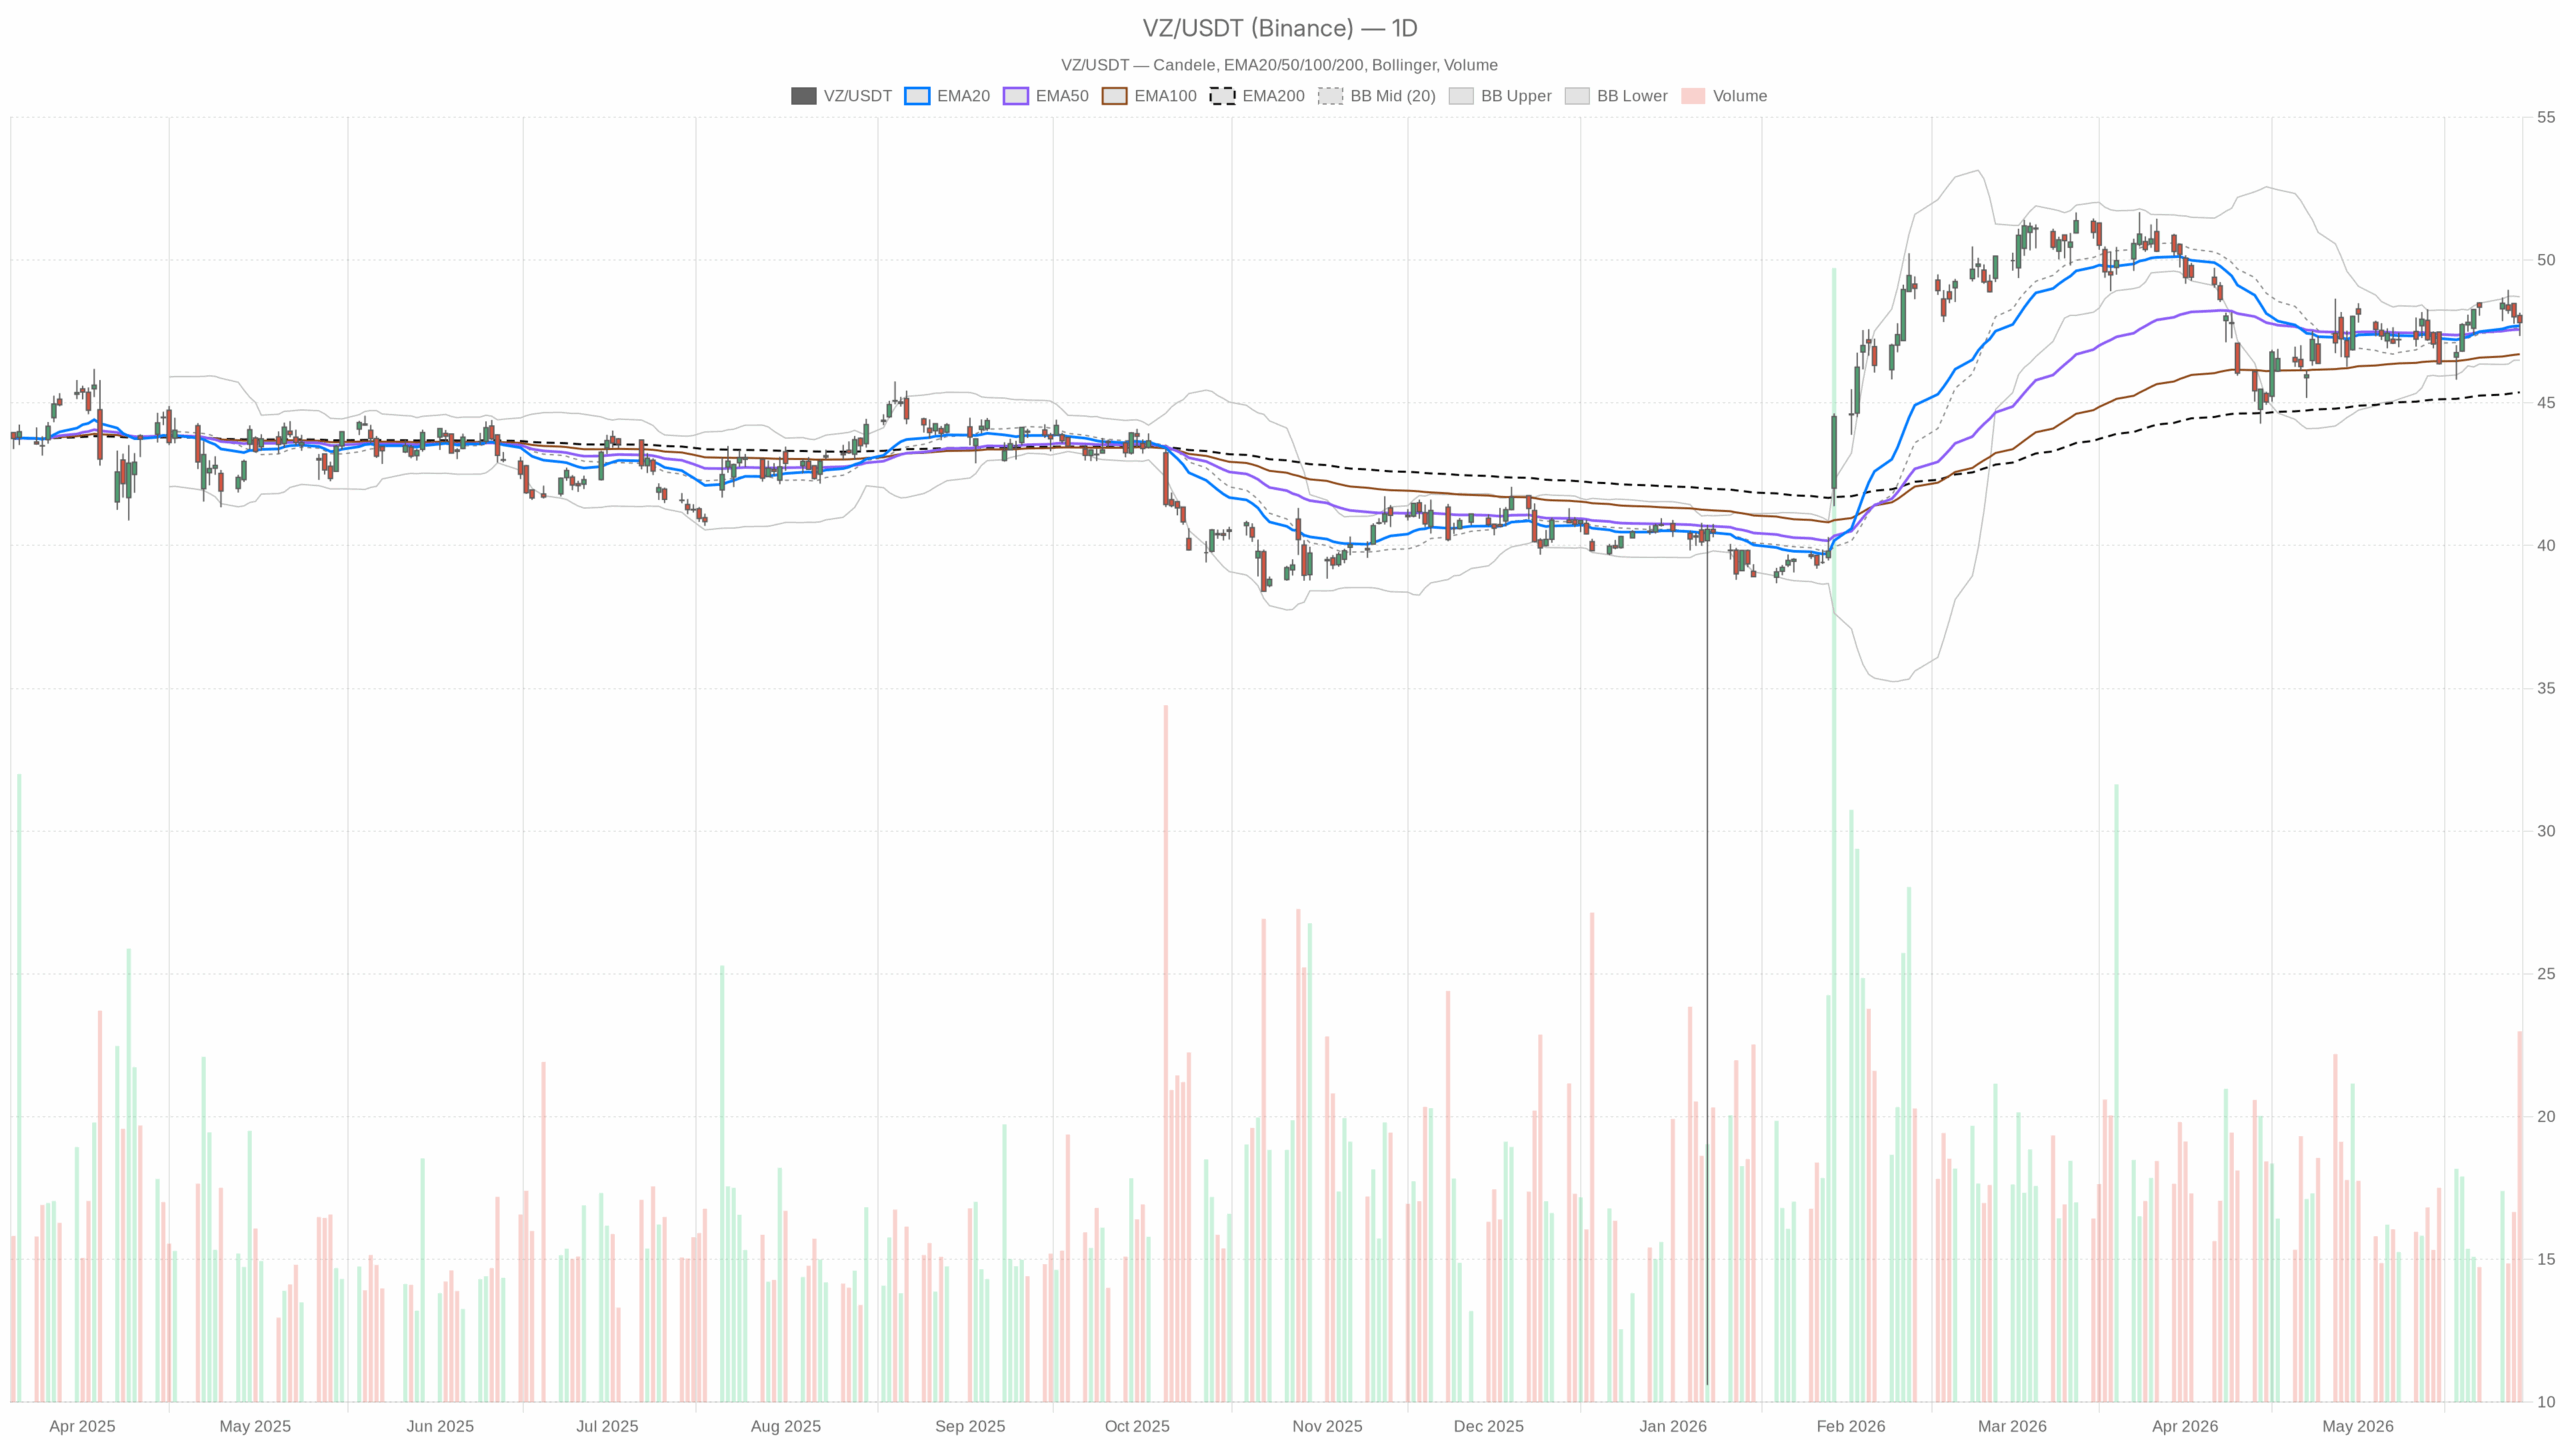 VZ — daily chart with candlesticks, EMA20/EMA50 and volume.
Verizon stock overview: daily uptrend vs intraday fade
Notably, a seven-session rally lifted sentiment last week, while the past month featured a pullback and mixed earnings signals. Verizon has also lagged broader telecoms even as some analysts stay optimistic. This split backdrop aligns with a firm daily structure but hesitant intraday participation.
Daily chart: structure, momentum, and volatility
VZ closed at 47.81, above the 20-, 50-, and 200-day EMAs at 47.70/47.57/45.37. That alignment signals an intact primary uptrend. Daily RSI14 is 51.4. Momentum is positive but not exuberant. Daily MACD sits above signal with a modest positive histogram (0.11).
Meanwhile, Bollinger Bands show a 47.60 mid, with an upper band near 48.71 and a lower band at 46.49. Price in the mid‑upper half leaves room toward the top band before pressure builds. Daily ATR14 is 0.87, implying grindy follow‑through rather than explosive extension.
The daily pivot is 47.77, with R1 at 48.20 and S1 at 47.38. Holding above the pivot keeps the bias constructive; losing it would dull the edge into support.
1-hour chart: consolidation and key intraday levels
In contrast, the 1‑hour view tempers the bullish tilt. Price sits below the 20/50‑hour EMAs at 48.04/48.02 but above the 200‑hour at 47.75. That is short‑term consolidation inside a larger uptrend. Hourly RSI14 is 41.9, and MACD is below signal with a negative histogram.
At the same time, hourly Bollinger Bands show a 48.15 mid and a 47.47 lower band. Trading below the mid keeps mild pressure without an oversold print. Hourly ATR14 is 0.29. Meanwhile, the hourly pivot is 47.87 with R1 at 48.01 and S1 at 47.70, placing the first battle line just above price.
15-minute execution map
Therefore, use the 15‑minute tape for execution only. Price hovers just under the 20/50/200 EMAs at 47.85/47.96/47.99, a soft micro‑trend below near‑term averages. The 15‑minute RSI14 at 47 is neutral. MACD is nudging above signal with a small positive histogram.
Meanwhile, bands sit near a 47.82 mid, 47.97 upper, and 47.66 lower, with ATR14 at 0.11. The pivot is 47.87, with R1 at 48.01 and S1 at 47.70. That setup offers clean triggers in a tight tape.
Trading scenarios for Verizon stock
Bullish path
A sustained reclaim of 48.01 on the hourly, then acceptance above 48.20 (daily R1), would align intraday with the daily uptrend. An RSI push back above 50 and a MACD cross up would validate momentum. From there, the daily upper band near 48.71 is the next logical magnet. With daily ATR at 0.87, progress should be incremental.
Weakening path
On the other hand, the bullish case weakens if price fails repeatedly at 48.01–48.20 and slips below 47.70 (hourly S1). A subsequent daily close below 47.38 (daily S1) would damage the constructive setup. In that outcome, room opens toward the daily lower band near 46.49, while hourly momentum likely stays below neutral.
Bottom line: cautiously bullish into 48
Overall, Verizon stock carries a daily uptrend with muted momentum and a hesitant intraday tone. Positioning near the 48 handle argues for patience and level‑by‑level confirmation. Volatility is moderate, so expect grindy moves until the 48.01–48.20 band breaks or 47.70 gives way.


You May Also Like

The changing face of elder care in Malaysia — Sayed Mohammad Reza Yamani Sayed Umar

Not a loophole: Singapore AI export controls let China tap US AI legally

Q2 Market Insights: Bitcoin regains dominance in risk-averse environment, ETFs remain critical to market structure


