

Ethereum price today below $2,000: risk of a test at 1,968–2,005

With the price near 1,983 dollars, the Ethereum price today remains below key averages: defending 1,980, risk of extension towards 1,968 and relief only above 2,005.
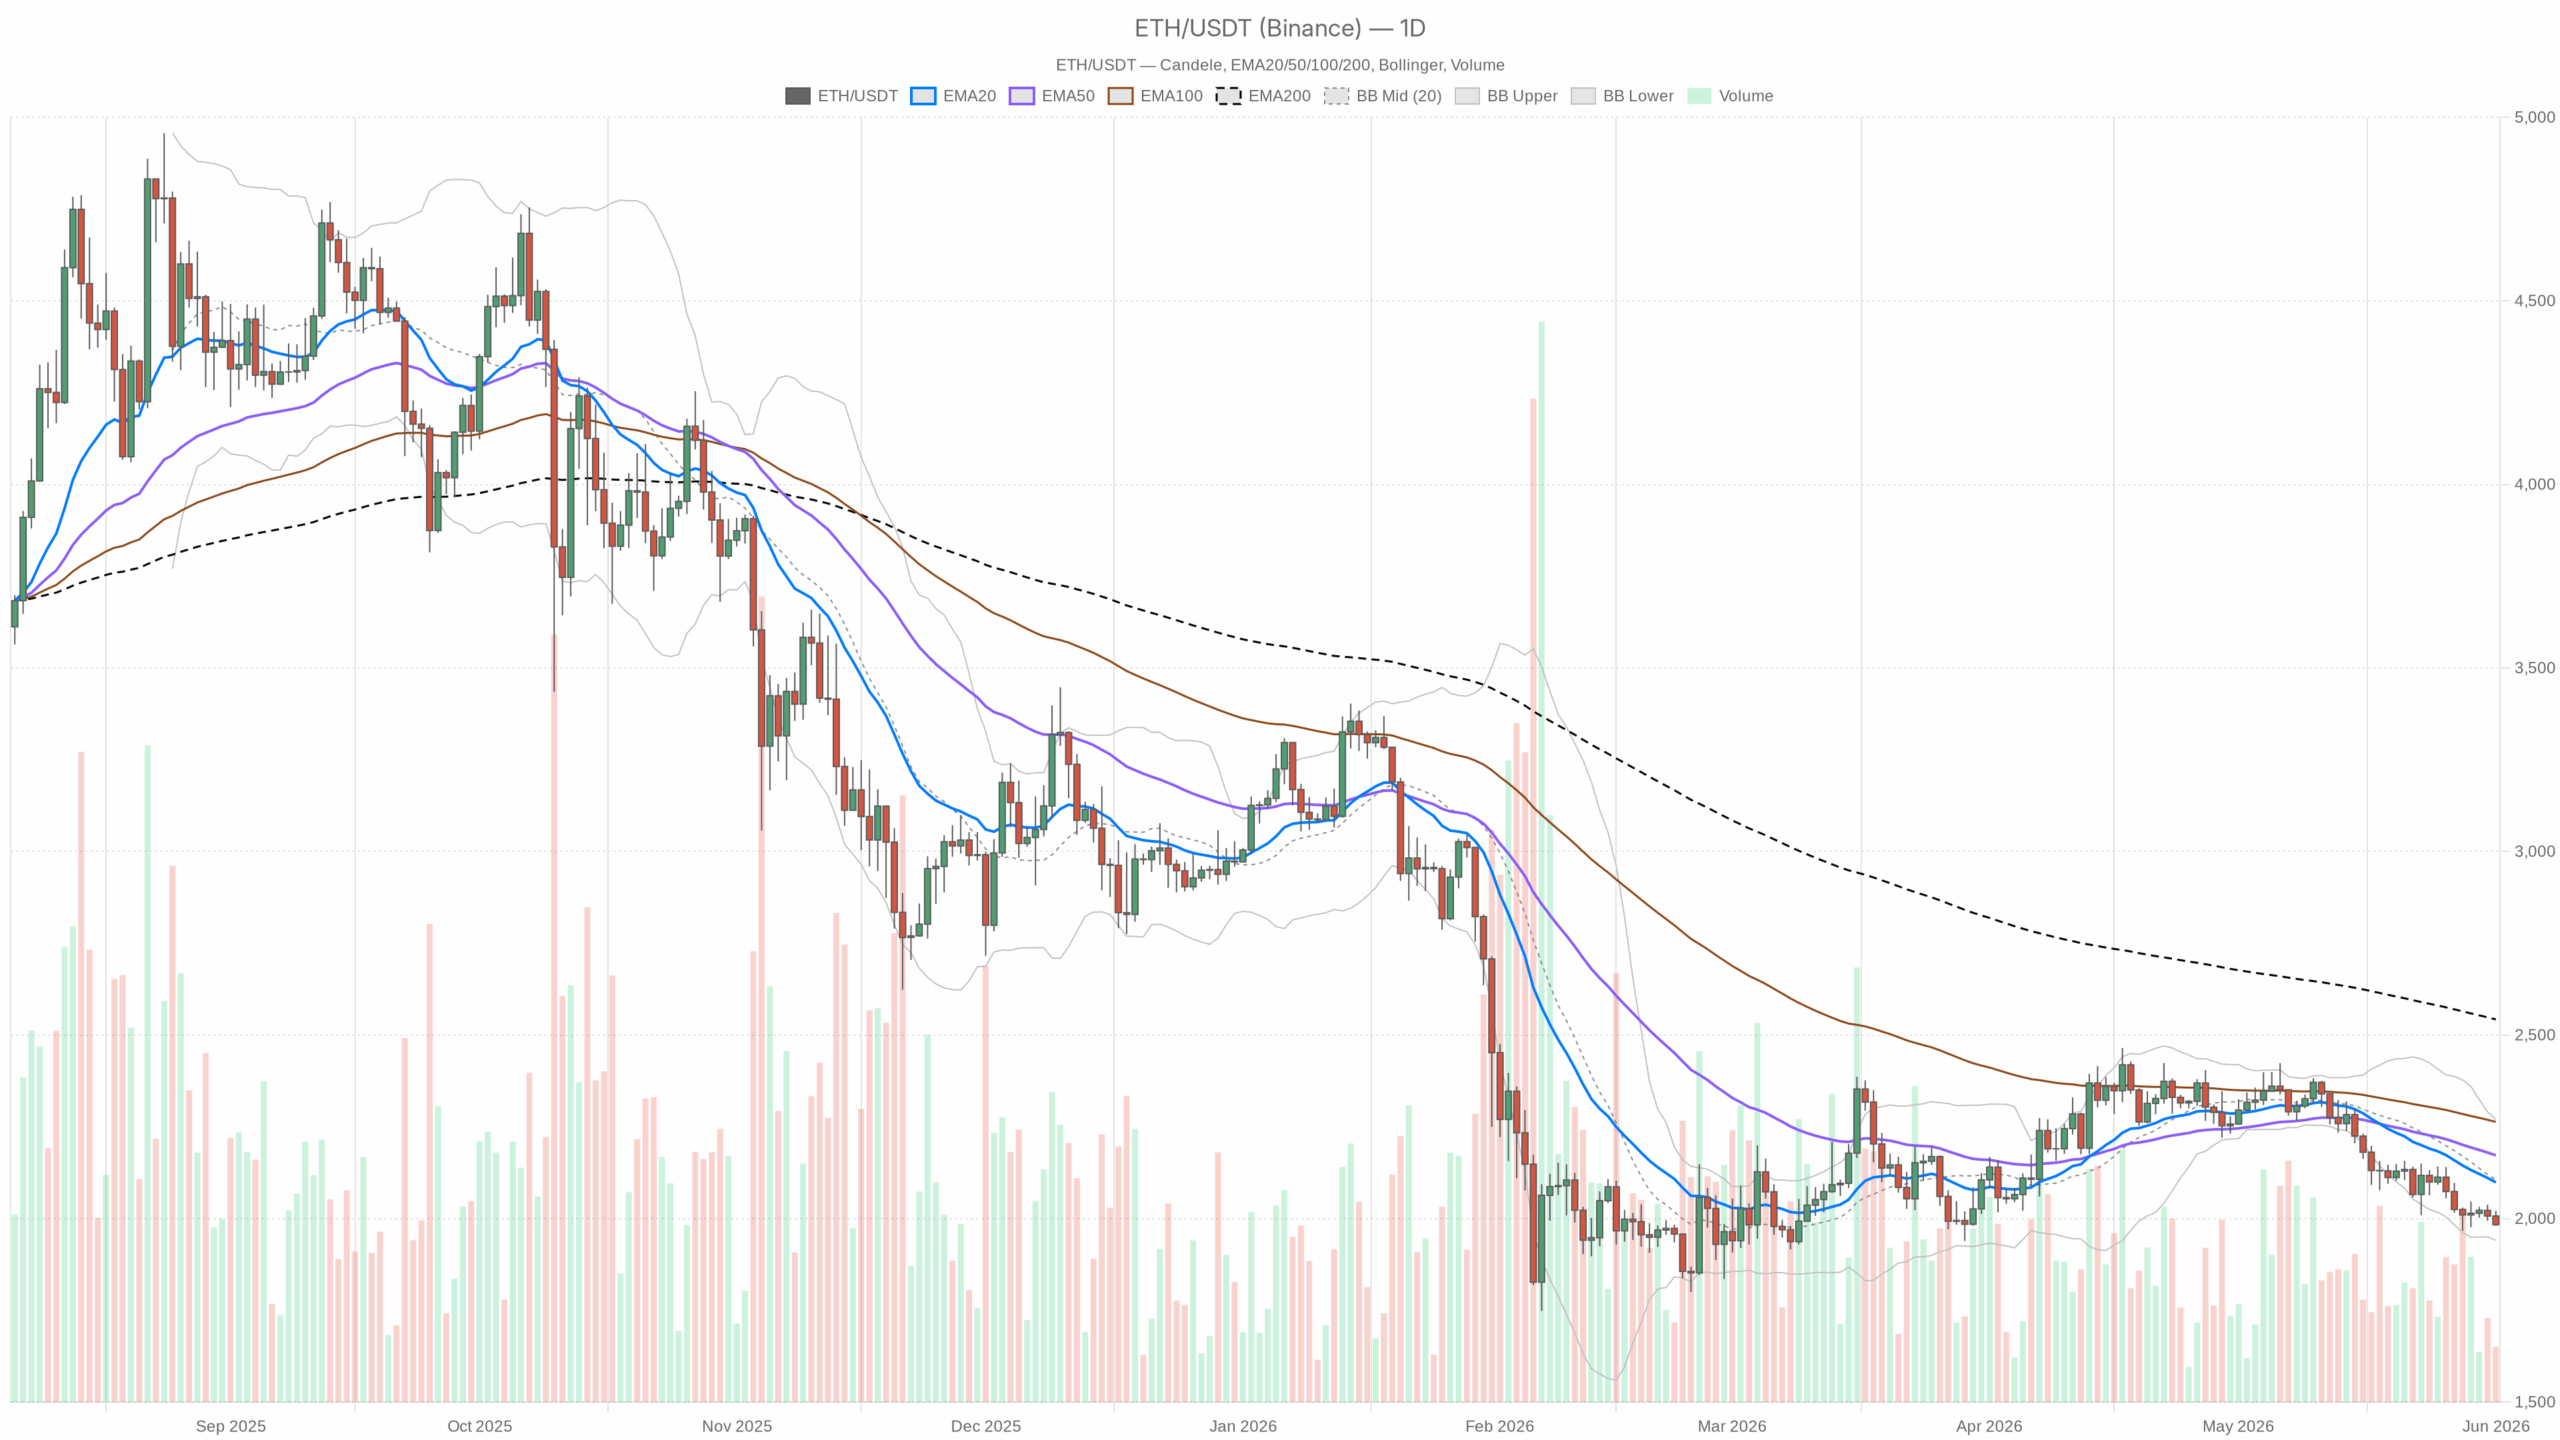 ETH/USDT — daily chart with candles, EMA20/EMA50 and volumes.
Context and thesis
The main trend (D1) is negative: price below all relevant EMAs and close to the lower Bollinger band. Momentum is weak, but the proximity to the band lows increases the probability of fast and fragile technical rebounds.
Intraday (H1 and 15m) the structure shows constant pressure with micro-compression around 1,982–1,985. It is a typical pre-break with risk of spikes in both directions.
The macro-crypto picture does not help: BTC dominance at 57.2% and a Fear & Greed index at 29 (fear) indicate a risk-off context, penalizing for alts. For those following the Ethereum price today in euros, pay attention to the EURUSD exchange rate, which can amplify or dampen moves, even though the price is pegged to the dollar on USDT. Data updated to 1 June 2026.
Multi-timeframe: direction and confirmations
- Daily (D1): main direction bearish. The price (1,983) is below EMA20 (2,098), EMA50 (2,172) and EMA200 (2,543). The proximity to the lower band (1,941) indicates pressure but also risk of technical rebounds.
- 1 Hour (H1): confirms the weakness. Trading below EMA20 (2,005) and below the H1 pivot (1,985); price just below the lower band (1,986), a signal of possible mean reversion towards 1,995–2,005 if sellers ease.
- 15 Min (m15): operational context of compression. Price near the pivot (1,983) with reduced ATR: likely short-term volatility expansion; direction driven by the break of 1,981/1,985.
Evidence from the technical picture
EMA (D1): price 1,983 below EMA20 2,098, EMA50 2,172, EMA200 2,543. In practice: fully bearish structure; rebounds so far sold below 2,100–2,170.
RSI 14 (D1): 29.9. In practice: weak momentum; technical rebounds possible, but price confirmations above resistances are needed before talking about a reversal.
MACD (D1): line -68.3/-59.2, histogram -9.1. In practice: bearish push still present; as long as the histogram does not move closer to zero, recoveries remain countertrend.
Bollinger (D1): median 2,106, lower band 1,941. In practice: trading near the lower band the market can crawl lower; the first constructive signal would be a return and hold above 2,106.
ATR 14 (D1): 64.9. In practice: average daily ranges of ~65 dollars; stops and targets must be calibrated on this scale to avoid premature exits.
Pivot (D1): PP 1,994.9, R1 2,009.8, S1 1,968.4. In practice: the price is below the PP and looking at S1; above R1 there is room towards 2,025–2,045.
Pivot (H1): PP 1,985.2, R1 1,988.3, S1 1,979.9. In practice: micro-equilibrium below the PP; loss of 1,980 opens a test at 1,968.
Pivot (m15): PP 1,983.5, R1 1,984.8, S1 1,981.3. In practice: the 1,981–1,985 area is the intraday magnet; the break directs the next short-term swing.
Levels and price behavior
- Immediate resistances: 1,988–2,005 (R1 H1 + EMA20 H1), then 2,010–2,013 (R1 D1 + EMA50 H1), 2,043 (EMA200 H1), 2,106 (D1 BB median).
- Supports: 1,981–1,980 (S1 m15/S1 H1), 1,968 (S1 D1), 1,941 (D1 lower BB). Below, room towards the psychological 1,900.
- Key behavior: repeated selling below 2,005 indicates sellers in control; acceptance above 2,010 would change the intraday tone.
Plausible bullish scenario
Recovery above 1,995 (D1 PP) and, especially, above 2,005 (H1 EMA20). Holding the pullback on 1,995–2,000 and push beyond 2,010–2,013 opens 2,025–2,043. Possible extension towards 2,106 (D1 Bollinger median). Strength signal: H1 closes above 2,010 with H1 RSI climbing back towards 45–50. Invalidation: new loss of 1,980 with volume, or D1 close below 1,968.
Plausible bearish scenario
Sharp rejection from 1,995–2,005 and break of 1,981–1,980: test of 1,968 (D1 S1). If no absorption appears, slide towards 1,941 (D1 lower band) and, in the tail, risk of a spike to 1,920–1,900. Confirmation signal: H1 walking below the lower band with rebounds unable to exceed 1,995. Invalidation: recovery and holding above 2,010–2,013 and subsequent break of 2,043 (H1 EMA200).
How to read the context now
Uncertain but downward-tilted market: in the context of the Ethereum price today, those trading countertrend must demand confirmations above 2,005–2,010. Otherwise rebounds risk being sold.
Typical false signals here: brief liquidity hunts above 2,000–2,005 and below 1,979–1,980, immediately reabsorbed. In addition, ATR guides positioning: on D1 ~65 dollars of average range and on H1 ~14, so stops that are too tight near key levels risk being swept away. For those following the Ethereum price chart and Ethereum price predictions, remember that the main bias remains short as long as the daily does not regain at least the 2,100 area (band median) with holding.
For the real-time ETH quote and the price in euros, monitor the order book and the EURUSD exchange rate: on strong dollar days, rebounds in USD may be dampened in EUR.


You May Also Like

MSFT Stock Today: $37B AI Surge Pushes Price Past Bollinger Bands as RSI Hits 73

Shiba Inu Price Prediction Weakens as AI Token Sector Surges 30% to $19B While Pepeto SHIB and TAO Take Different Paths

Covéa Chooses Shift Technology as Strategic Partner for Fraud and Risk Management


